MATLAB: An Introduction with Applications
6th Edition
ISBN: 9781119256830
Author: Amos Gilat
Publisher: John Wiley & Sons Inc
expand_more
expand_more
format_list_bulleted
Topic Video
Question

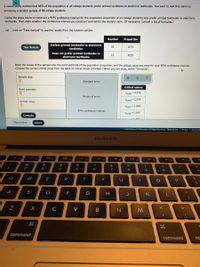
Transcribed Image Text:A recent study claimed that 66% of the population of all college students prefer printed textbooks to electronic textbooks. You want to test this daim by
surveying a random sample of 68 college students.
Follow the steps below to construct a 95% confidence interval for the population proportion of all college students who prefer printed textbooks to electronic
textbooks. Then state whether the confidence interval you construct contradicts the study's claim. (If necessary, consult a list of formulas.)
(a) Click on "Take Sample" to see the results from the random sample.
Number
Proportion
Prefers printed textbooks to electronic
Take Sample
51
0.75
textbooks
Does not prefer printed textbooks to
electronic textbooks
17
0.25
Enter the values of the sample size, the point estimate of the population proportion, and the critical value you need for your 95% confidence interval.
(Choose the correct critical value from the table of critical values provided.) When you are done, select "Compute".
Sample size:
Standard error:
Critical values
Point estimate:
F0.00s =2.576
Margin of error:
F0.010 -2.326
Critical value:
20.025 =1.960
95% confidence interval:
F0.050-1.645
Compute
Explanation
Check
2021 McGraw HI Education. AllRights Reserved Terms of Use
Privacy I Accessibil
MacBook Air
888
FB
%23
24
&
2
3
4
5
6
8
Q
W
E
Y
P
A
D
G
K
L
C
V
B
command
command
op
V

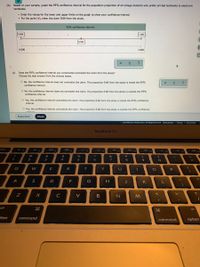
Transcribed Image Text:(b) Based on your sample, graph the 95% confidence interval for the population proportion of all college students who prefer printed textbooks to electronic
textbooks.
· Enter the values for the lower and upper limits on the graph to show your confidence interval.
• For the point (), enter the claim 0.66 from the study.
95% confidence interval:
0.000
1.000
0.500
0.000
1.000
(c)
Does the 95% confidence interval you constructed contradict the claim from the study?
Choose the best answer from the choices below.
O No, the confidence interval does not oontradict the claim. The proportion 0.66 from the study is inside the 95%
confidence interval. .
O No, the confidence interval does not contradict the claim. The proportion 0.66 from the study is outside the 95%
confidence interval.
O Yes, the confidence interval contradicts the claim. The proportion 0.66 from the study
interval.
inside the 95% confidence
O Yes, the confidence interval contradicts the claim. The proportion 0.66 from the study is outside the 95% confidence
intonal
Explanation
Check
2021 McGraw Hill Education. All Rights Reserved Terms of Use
Privacy I Accessibility
MacBook Air
esc
%23
%24
&
3
4
6
9
Q
E
R
Y
U
P
A
D
F
H
K
V
alt
alt
tion
command
command
option
in
Expert Solution
This question has been solved!
Explore an expertly crafted, step-by-step solution for a thorough understanding of key concepts.
This is a popular solution
Trending nowThis is a popular solution!
Step by stepSolved in 3 steps

Knowledge Booster
Learn more about
Need a deep-dive on the concept behind this application? Look no further. Learn more about this topic, statistics and related others by exploring similar questions and additional content below.Similar questions
- A national organization conducted a survey of 1300 American adults and asked how many hours they work each week, on average. The organization reported that American adults work a mean of 40.5 hours each week. The study reported a margin of error of 0.8 hours. (Assume 95% confidence was used.) Step 1 of 3 : Calculate the lower and upper endpoints of the confidence interval. Do not round answers.arrow_forwardPlease answer the following question using *****EXCEL****arrow_forwardAccording to a poll, 86% of California adults (434 out of 506 surveyed) feel that education is one of the top issues facing California. We wish to construct a 90% confidence interval for the true proportion of California adults who feel that education is one of the top issues facing California. Find a 90% confidence interval for the population proportion. (Round your answers to three decimal places.) X * Enter a number.arrow_forward
- A survey of 240 teachers found that two-thirds of those surveyed do not live in Sydney. Can you conclude statistically that the population proportion who do not live in Sydney is less than 0.75? Use a 95% confidence interval. What is the confidence interval and is 0.75 within the interval?arrow_forwardA beverage company would like to determine if their drink is preferred to a rival company’s drink. They perform an experiment with 150 randomly selected individuals and have them taste test the two different drinks in a controlled environment so that each person's preference is independent of others. A 90% confidence interval for the proportion preferring their drink is (0.453, 0.587). Which of the following is the correct interpretation of this confidence interval? 90% of all consumers prefer this beverage company’s drink to their rival’s between 45.3% and 58.7% of the time. We’re 90% confident that between 45.3% and 58.7% of all consumers would prefer this beverage company’s drink to their rival’s drink. We’re 90% confident that there’s a 45.3% to 58.7% chance that a randomly selected person would prefer this beverage company’s drink to their rival’s drink. We’re 90% confident that the proportion of people in the sample who prefer this beverage company’s drink over their…arrow_forwardA study is conducted by a physical therapist to determine whether there is a difference in the proportion of men and women in the U.S. that participate in regular sustained physical activity. It is found that 22% of menout of 550 and 19.5% of women out of 450 participated in regular sustained physical activity. Construct a 90% confidence interval for the difference in proportions of men and women that participate in regular sustained and state your conclusion.arrow_forward
- A recent poll indicated that 42% of men supported raises taxes to fund additional park services. The poll also found that 64% of women supported such a tax. The sample consisted of 29 men and 25 women. Construct a 90% confidence interval around the difference in proportions.arrow_forwardA random sample of 1700 car owners in a particular city found 816 car owners who received a speeding ticket this year. Using the Wilson "plus four" technique, find a 95% confidence interval for the true percent of car owners in this city who received a speeding ticket this year. Express your results to the nearest hundredth of a percent.arrow_forwardA marketing research company is estimating which of two soft drinks college students prefer. A random sample of n college students produced the following 95% confidence interval for the proportion of the college students who prefer to drink A:(0.342,0.482). Identify the point estimate for estimating the true proportion of college students who prefer that drink.arrow_forward
arrow_back_ios
arrow_forward_ios
Recommended textbooks for you
 MATLAB: An Introduction with ApplicationsStatisticsISBN:9781119256830Author:Amos GilatPublisher:John Wiley & Sons Inc
 Probability and Statistics for Engineering and th...StatisticsISBN:9781305251809Author:Jay L. DevorePublisher:Cengage Learning
 Statistics for The Behavioral Sciences (MindTap C...StatisticsISBN:9781305504912Author:Frederick J Gravetter, Larry B. WallnauPublisher:Cengage Learning
 Elementary Statistics: Picturing the World (7th E...StatisticsISBN:9780134683416Author:Ron Larson, Betsy FarberPublisher:PEARSON
 The Basic Practice of StatisticsStatisticsISBN:9781319042578Author:David S. Moore, William I. Notz, Michael A. FlignerPublisher:W. H. Freeman
 Introduction to the Practice of StatisticsStatisticsISBN:9781319013387Author:David S. Moore, George P. McCabe, Bruce A. CraigPublisher:W. H. Freeman

MATLAB: An Introduction with Applications
Statistics
ISBN:9781119256830
Author:Amos Gilat
Publisher:John Wiley & Sons Inc

Probability and Statistics for Engineering and th...
Statistics
ISBN:9781305251809
Author:Jay L. Devore
Publisher:Cengage Learning

Statistics for The Behavioral Sciences (MindTap C...
Statistics
ISBN:9781305504912
Author:Frederick J Gravetter, Larry B. Wallnau
Publisher:Cengage Learning

Elementary Statistics: Picturing the World (7th E...
Statistics
ISBN:9780134683416
Author:Ron Larson, Betsy Farber
Publisher:PEARSON

The Basic Practice of Statistics
Statistics
ISBN:9781319042578
Author:David S. Moore, William I. Notz, Michael A. Fligner
Publisher:W. H. Freeman

Introduction to the Practice of Statistics
Statistics
ISBN:9781319013387
Author:David S. Moore, George P. McCabe, Bruce A. Craig
Publisher:W. H. Freeman