
MATLAB: An Introduction with Applications
6th Edition
ISBN: 9781119256830
Author: Amos Gilat
Publisher: John Wiley & Sons Inc
expand_more
expand_more
format_list_bulleted
Related questions
Concept explainers
Topic Video
Question
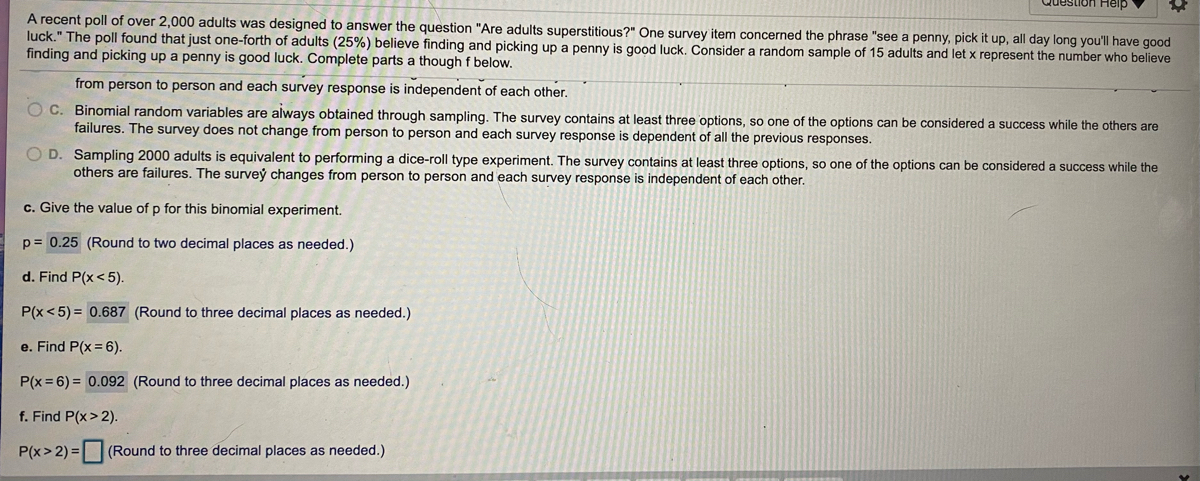

Transcribed Image Text:**Binomial Probability and Superstitions: An Educational Exploration**
---
**Overview:**
A recent poll surveyed over 2,000 adults to investigate the question: "Are adults superstitious?" One item in the survey addressed the belief "see a penny, pick it up, all day long you'll have good luck." The poll determined that 25% (one-fourth) of adults hold this belief. We will consider a random sample of 15 adults and let \( x \) represent the number who believe that finding and picking up a penny is good luck. We aim to study the binomial distribution applied to this scenario.
**Binomial Experiment Assumptions:**
A binomial experiment satisfies the following criteria:
- There is a fixed number of trials.
- Each trial has two possible outcomes: success or failure.
- The probability of success is the same for each trial.
- Trials are independent of each other.
**Evaluate Statements Regarding the Poll:**
1. **Statement C:**
- Binomial random variables are always obtained through sampling. The survey contains at least three options, so one of the options can be considered a success while the others are failures. The survey does not change from person to person and each survey response is dependent on all the previous responses.
2. **Statement D (False):**
- Sampling 2000 adults is equivalent to performing a dice-roll type experiment. The survey contains at least three options, so one of the options can be considered a success while the others are failures. The survey changes from person to person and each survey response is independent of each other.
**Calculations:**
a. **Determine the probability of success (p) for this binomial experiment:**
\( p = 0.25 \)
(Rounded to two decimal places as needed.)
b. **Find \( P(x < 5) \):**
\( P(x < 5) = 0.687 \)
(Rounded to three decimal places as needed.)
c. **Find \( P(x = 6) \):**
\( P(x = 6) = 0.092 \)
(Rounded to three decimal places as needed.)
d. **Find \( P(x \geq 2) \):**
\( P(x \geq 2) = \)
(Rounded to three decimal places as needed.)
---
This educational content explores the binomial probability distribution
Expert Solution
This question has been solved!
Explore an expertly crafted, step-by-step solution for a thorough understanding of key concepts.

This is a popular solution

Trending nowThis is a popular solution!

Step by stepSolved in 3 steps with 4 images

Knowledge Booster


Learn more about
Need a deep-dive on the concept behind this application? Look no further. Learn more about this topic, statistics and related others by exploring similar questions and additional content below.Similar questions
- This is one question only, 2 parts if you can't explain concept pls skip, and dont do handwritten. If you are told that, in general, 55% of all mice exhibit a particular behavior, and you take a random sample of 100 mice and discover that this particular behavior occurs in 78% of your sample, do you think that the mice you've selected are, by chance, different from most mice, or do you think that the given percentage of 55% is not correct? What do you base your answer on? : If you know for certain, that the behavior referred to in the previous question is, in fact, 55%, then what possibly could account for getting a random sample of 78%? If your sample wasn't random, what might account for getting a sample proportion of 78%?.arrow_forwardA researcher wants to determine if people who watch 2 or more hours of television a day are happier than those who don't watch television. The researcher randomly picks 20 people. Half were asked to watch television for at least 2 hours a day for 2 weeks and the other half were asked not to watch television for 2 weeks. What type of research is this? o an observational study O a census O a survey O an experimentarrow_forwardA literature professor decides to give a 10-question true - false quiz to determine who has read an assigned novel. b. She wants to choose the passing grade such that the probability of passing a student who guesses on every question is less than .05. What score should she set as the lowest passing grade?arrow_forward
- a. If a coin is tossed nine times, how many different outcomes are possible? b. If a four-sided die is tossed nine times, how many different outcomes are possible? c. Discuss the differences in your answers to (a) and (b).arrow_forwardAccording to research, 55% of millennials (those born between 1981 and 1997) reported using a library or bookmobile within the last year. Suppose that a random sample of 200 millennials is taken. Complete parts a and b below. Since 195 is a. Complete this sentence: We would expect We would expect 110 of the sample to have used a library or bookmobile within the last year, give or take (Round to the nearest integer as needed.) b. Would it be surprising to find that 195 of the sample have used a library or bookmobile within the last year? Why or why not? be surprising. ▼than 2 of the sample to have used a library or bookmobile within the last year, give or take 1. from the itarrow_forwardA report describes a survey of 251 adult Americans. Participants in the survey were asked how often they disinfect their phone and were asked to respond with one of the following categories: more than once a week, once a week, every other, week, every three weeks, or less often than every three weeks. For this group, 9% responded more than once a week, 52% responded once a week, 26% responded every other week, 6% responded every three weeks, and 7% responded less often than every three weeks. Fill in the table below with the relative frequency distributions. How Often? Relative Frequency More than once a week Once a week Every other week Every three weeks Less often than every three weeksarrow_forward
- Pamela, and educational psychologist, is interested in assessing whether there are differences in how college students with different majors might respond to an ethical dilemma. To this end, she performed a study in which undergraduate marketing and finance majors were asked what they would do if they found a $100 bill in a Walton College of Business classroom. Specifically, would they turn in the $100 bill to the Walton College of Business lost and found? Of the 69 marketing majors who were randomly sampled, 52 said yes and of the 131 finance majors who were randomly sampled, 120 said yes (assume alpha equals .05). z-Test: Two Sample for Means t-Test: Two-Sample Assming Equal Variances Marketing Finance Marketing Finance Меan 0.75362 0.91603 Меan 0.75362 0.91603 Known Variance 0.43 0.28 Variance 0.18841 0.07751 Observations 69 131 Observations 69 131 Hypothesized Mean Difference Pooled Variance 0.1156 -1.7753 Hypothesized Mean DifferenCE z P(Z<-z) one-tail z Critical one-tail P(Z<-z)…arrow_forwardAn anger-management course claims that, after completing its seminar, participants will lose their tempers less often. Always a skeptic, you decide to test this claim. A random sample of 12 seminar participants is chosen, and these participants are asked to record the number of times that they lost their tempers in the two weeks prior to the course. After the course is over, the same participants are asked to record the number of times that they lost their tempers in the next two weeks. The following table lists the results of the survey. Using these data, test the claim at the 0.01 level of significance assuming that the population distribution of the paired differences is approximately normal. Let participants before completing the anger-management course be Population 1 and let participants after completing the anger-management course be Population 2. Number of Times Temper Was Lost during a Two-Week Period Before 10 6 8 10 6 3 10 3 8 After 6 7 4 4 8 6 4 9 3 7 Copy Data Step 2 of 3:…arrow_forwardSection 11.2 Question #4 The table below includes results from polygraph (lie detector) experiments conducted by researchers. In each case, it was known if the subjected lied or did not lie, so the table indicates when the polygraph test was correct. Use a 0.05 significance level to test the claim that whether a subject lies is independent of the polygraph test indication. Do the results suggest that polygraphs are effective in distinguishing between truth and lies? View the table Did the Subject Actually Lie? No (Did Not Lie) Yes (Lied) Polygraph test indicated that the subject lied. 9 48 Polygraph test indicated that the subject did not lie. 30 12 Determine the test statistic. χ2= _________ (Round to three decimal places as needed.) Determine the P-value of the test statistic. P-value= ___________ (Round to four decimal places as needed.)arrow_forward
- Help with this whole problemarrow_forwardBased on information from Harper's Index, 37 out of a random sample of 100 adult Americans who did not attend college believe in extraterrestrials. However, out of a random sample of 100 adult Americans who did attend college, 47 claim that they believe in extraterrestrials. Does this indicate that the proportion of people who attend college and who believe in extraterrestrials is higher than the proportion who did not attend college? (a) State the hypotheses in plain language. (b) Fill in the table below, then enter this table in the left side of the Rossman-Chance applet. No college College Total Believe in ETs 84 Did not believe in ETs 116 Total 100 100 200 (c) Compute the point estimate for the difference in the proportion believing in extraterrestrials between those not attending college and those attending college. Pne – Pe = (d) Complete at least 1000 simulations in the Rossman-Chance app 2 and report your findings below. (For help with the applet, refer to the e "Using the…arrow_forwardThe fractions of colors in a population of squirrels is 0.73 red and 0.27 black. If two are chosen at random, what are the chances they have the same color? Give two digits past decimal.arrow_forward
arrow_back_ios
SEE MORE QUESTIONS
arrow_forward_ios
Recommended textbooks for you
- MATLAB: An Introduction with ApplicationsStatisticsISBN:9781119256830Author:Amos GilatPublisher:John Wiley & Sons Inc
 Probability and Statistics for Engineering and th...StatisticsISBN:9781305251809Author:Jay L. DevorePublisher:Cengage Learning
 Statistics for The Behavioral Sciences (MindTap C...StatisticsISBN:9781305504912Author:Frederick J Gravetter, Larry B. WallnauPublisher:Cengage Learning
  Elementary Statistics: Picturing the World (7th E...StatisticsISBN:9780134683416Author:Ron Larson, Betsy FarberPublisher:PEARSON
 The Basic Practice of StatisticsStatisticsISBN:9781319042578Author:David S. Moore, William I. Notz, Michael A. FlignerPublisher:W. H. Freeman
 Introduction to the Practice of StatisticsStatisticsISBN:9781319013387Author:David S. Moore, George P. McCabe, Bruce A. CraigPublisher:W. H. Freeman
MATLAB: An Introduction with Applications
Statistics
ISBN:9781119256830
Author:Amos Gilat
Publisher:John Wiley & Sons Inc
Probability and Statistics for Engineering and th...
Statistics
ISBN:9781305251809
Author:Jay L. Devore
Publisher:Cengage Learning
Statistics for The Behavioral Sciences (MindTap C...
Statistics
ISBN:9781305504912
Author:Frederick J Gravetter, Larry B. Wallnau
Publisher:Cengage Learning
Elementary Statistics: Picturing the World (7th E...
Statistics
ISBN:9780134683416
Author:Ron Larson, Betsy Farber
Publisher:PEARSON
The Basic Practice of Statistics
Statistics
ISBN:9781319042578
Author:David S. Moore, William I. Notz, Michael A. Fligner
Publisher:W. H. Freeman
Introduction to the Practice of Statistics
Statistics
ISBN:9781319013387
Author:David S. Moore, George P. McCabe, Bruce A. Craig
Publisher:W. H. Freeman