
MATLAB: An Introduction with Applications
6th Edition
ISBN: 9781119256830
Author: Amos Gilat
Publisher: John Wiley & Sons Inc
expand_more
expand_more
format_list_bulleted
Related questions
Concept explainers
Question
How did they get the 1.75? Using Confidence intervals. Please explain don’t understand how they used the z table they said they used .46

Transcribed Image Text:+
A Read aloud
Fit to page
Page view
|
I
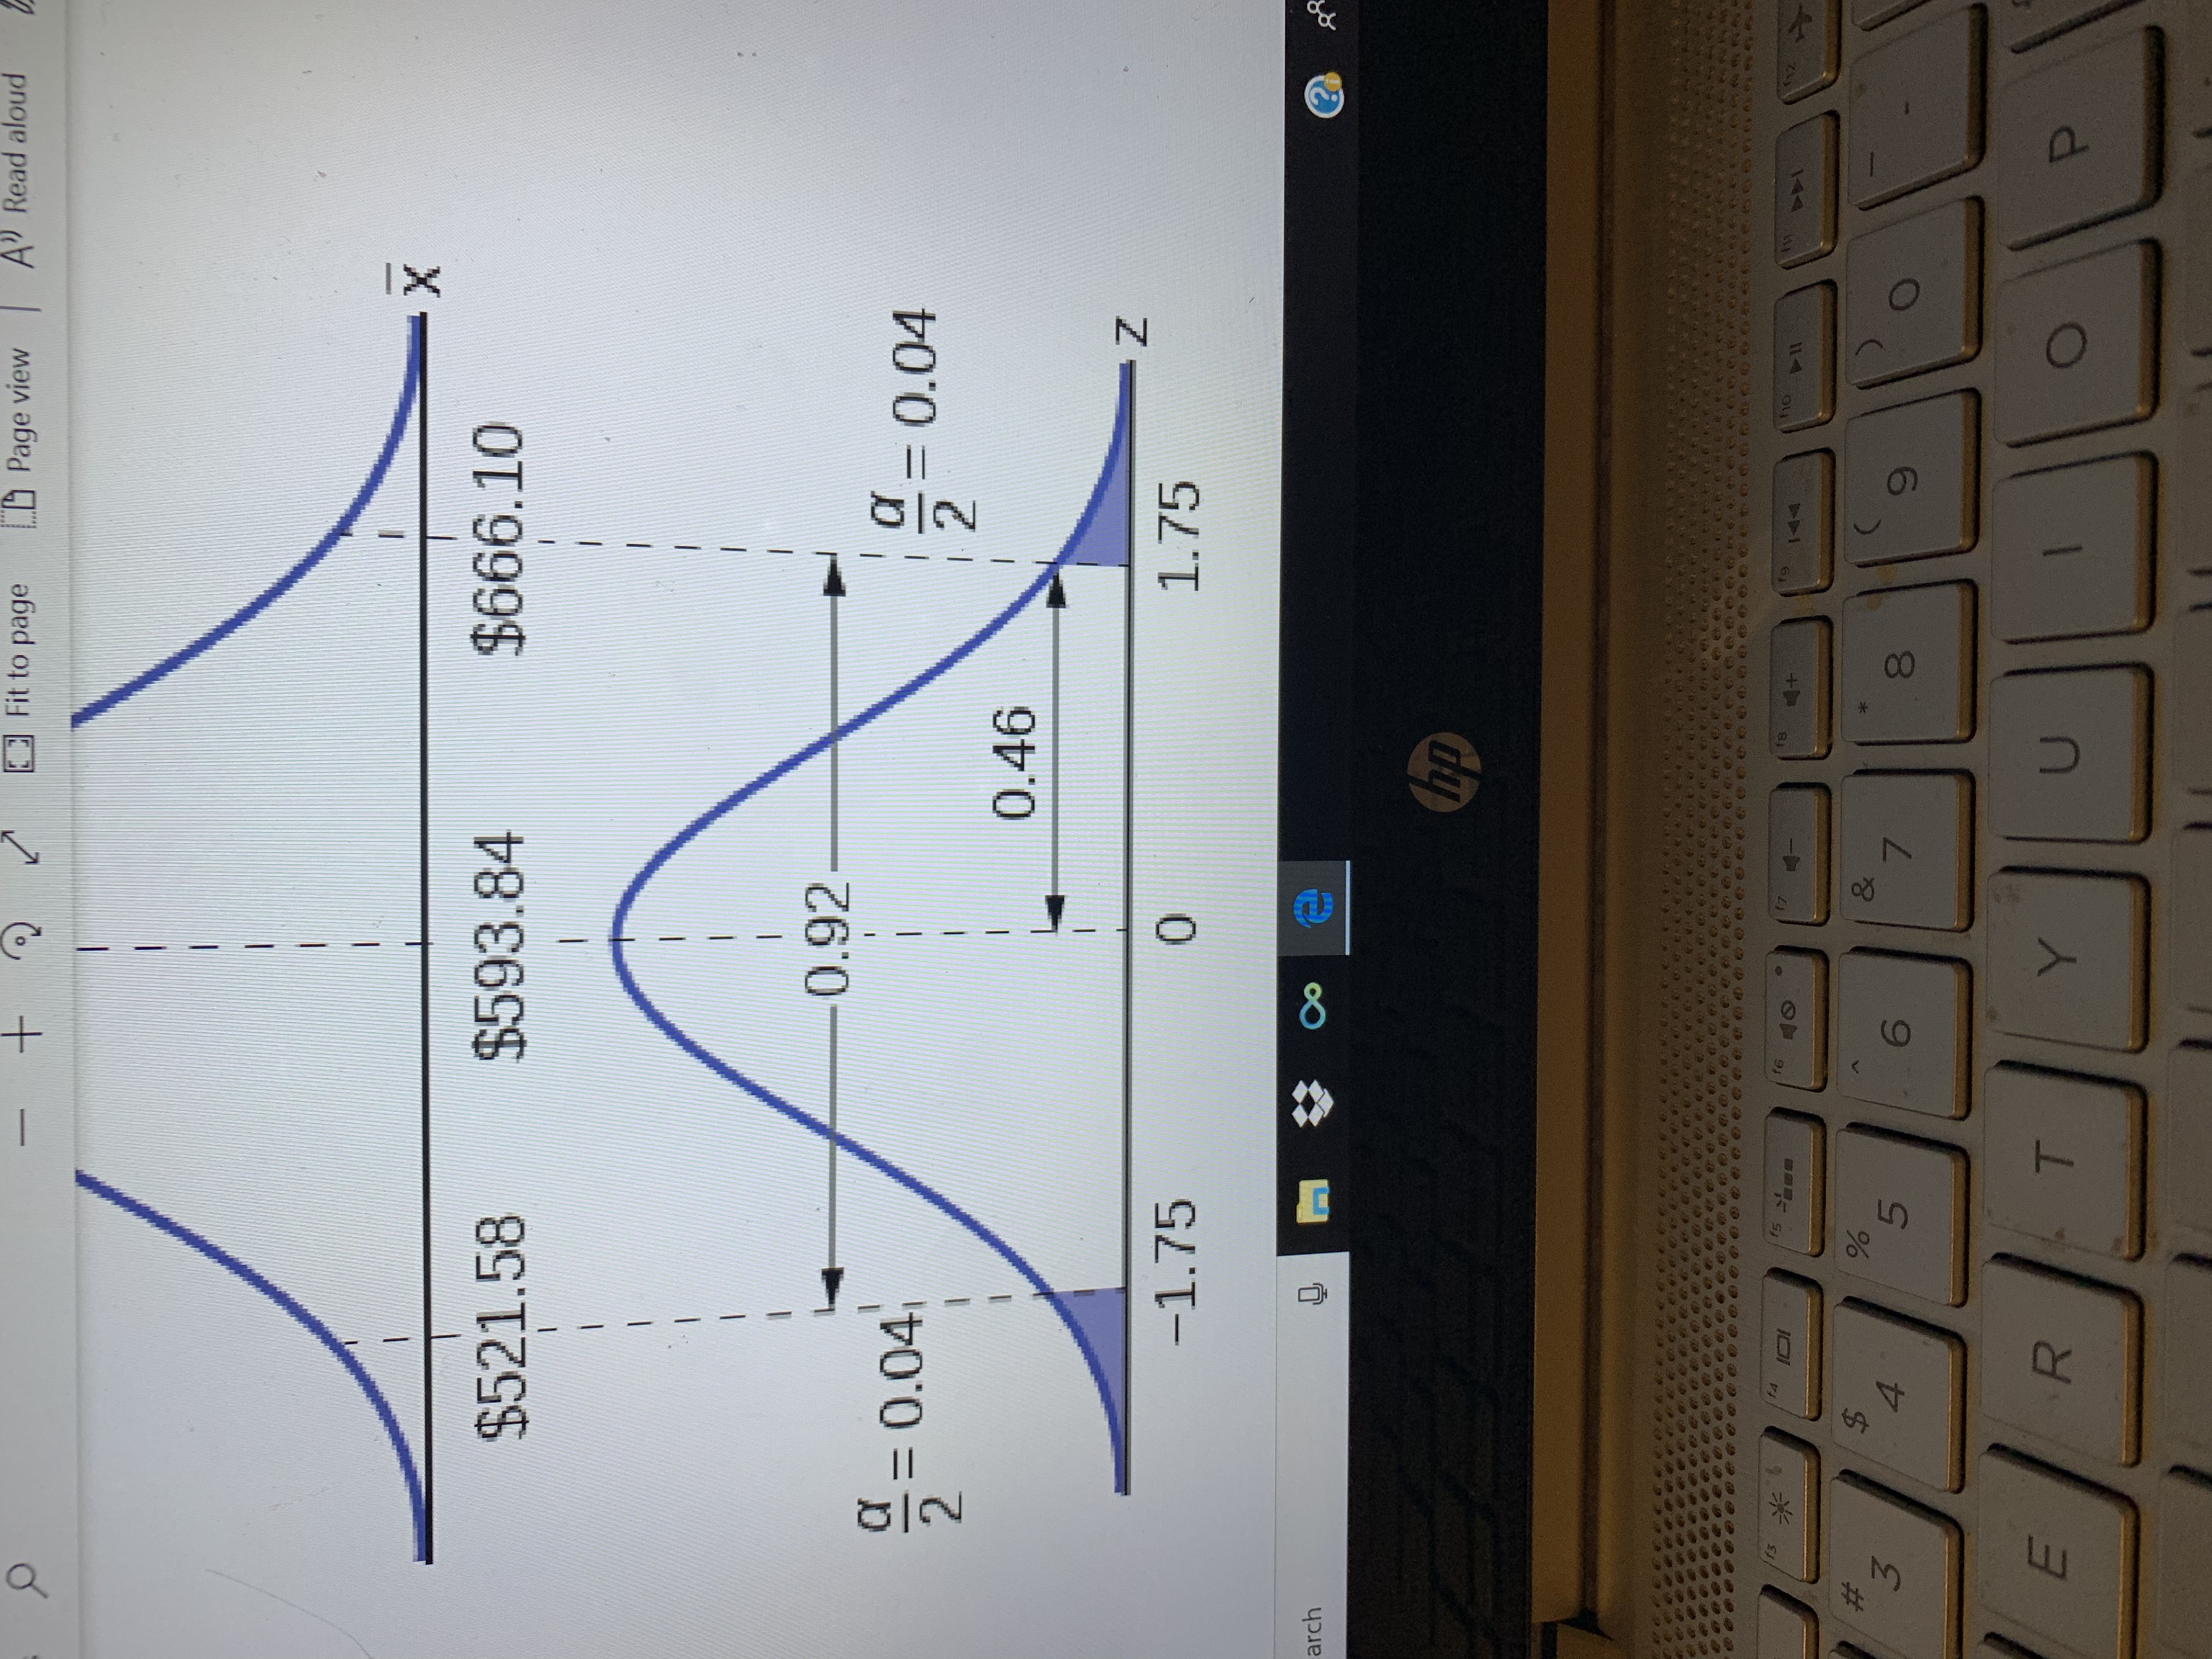
X
$666.10
$593.84
$521.58
0.92
0.04
2
0.04
2
0.46
- Z
-1.75
1.75
arch
hp
fa
fs
f6
T8
ho
fo
ASt
44
$
4
&
3
5
7
Y
P
00
8
LE
Transcribed Image Text:+
Fit to page
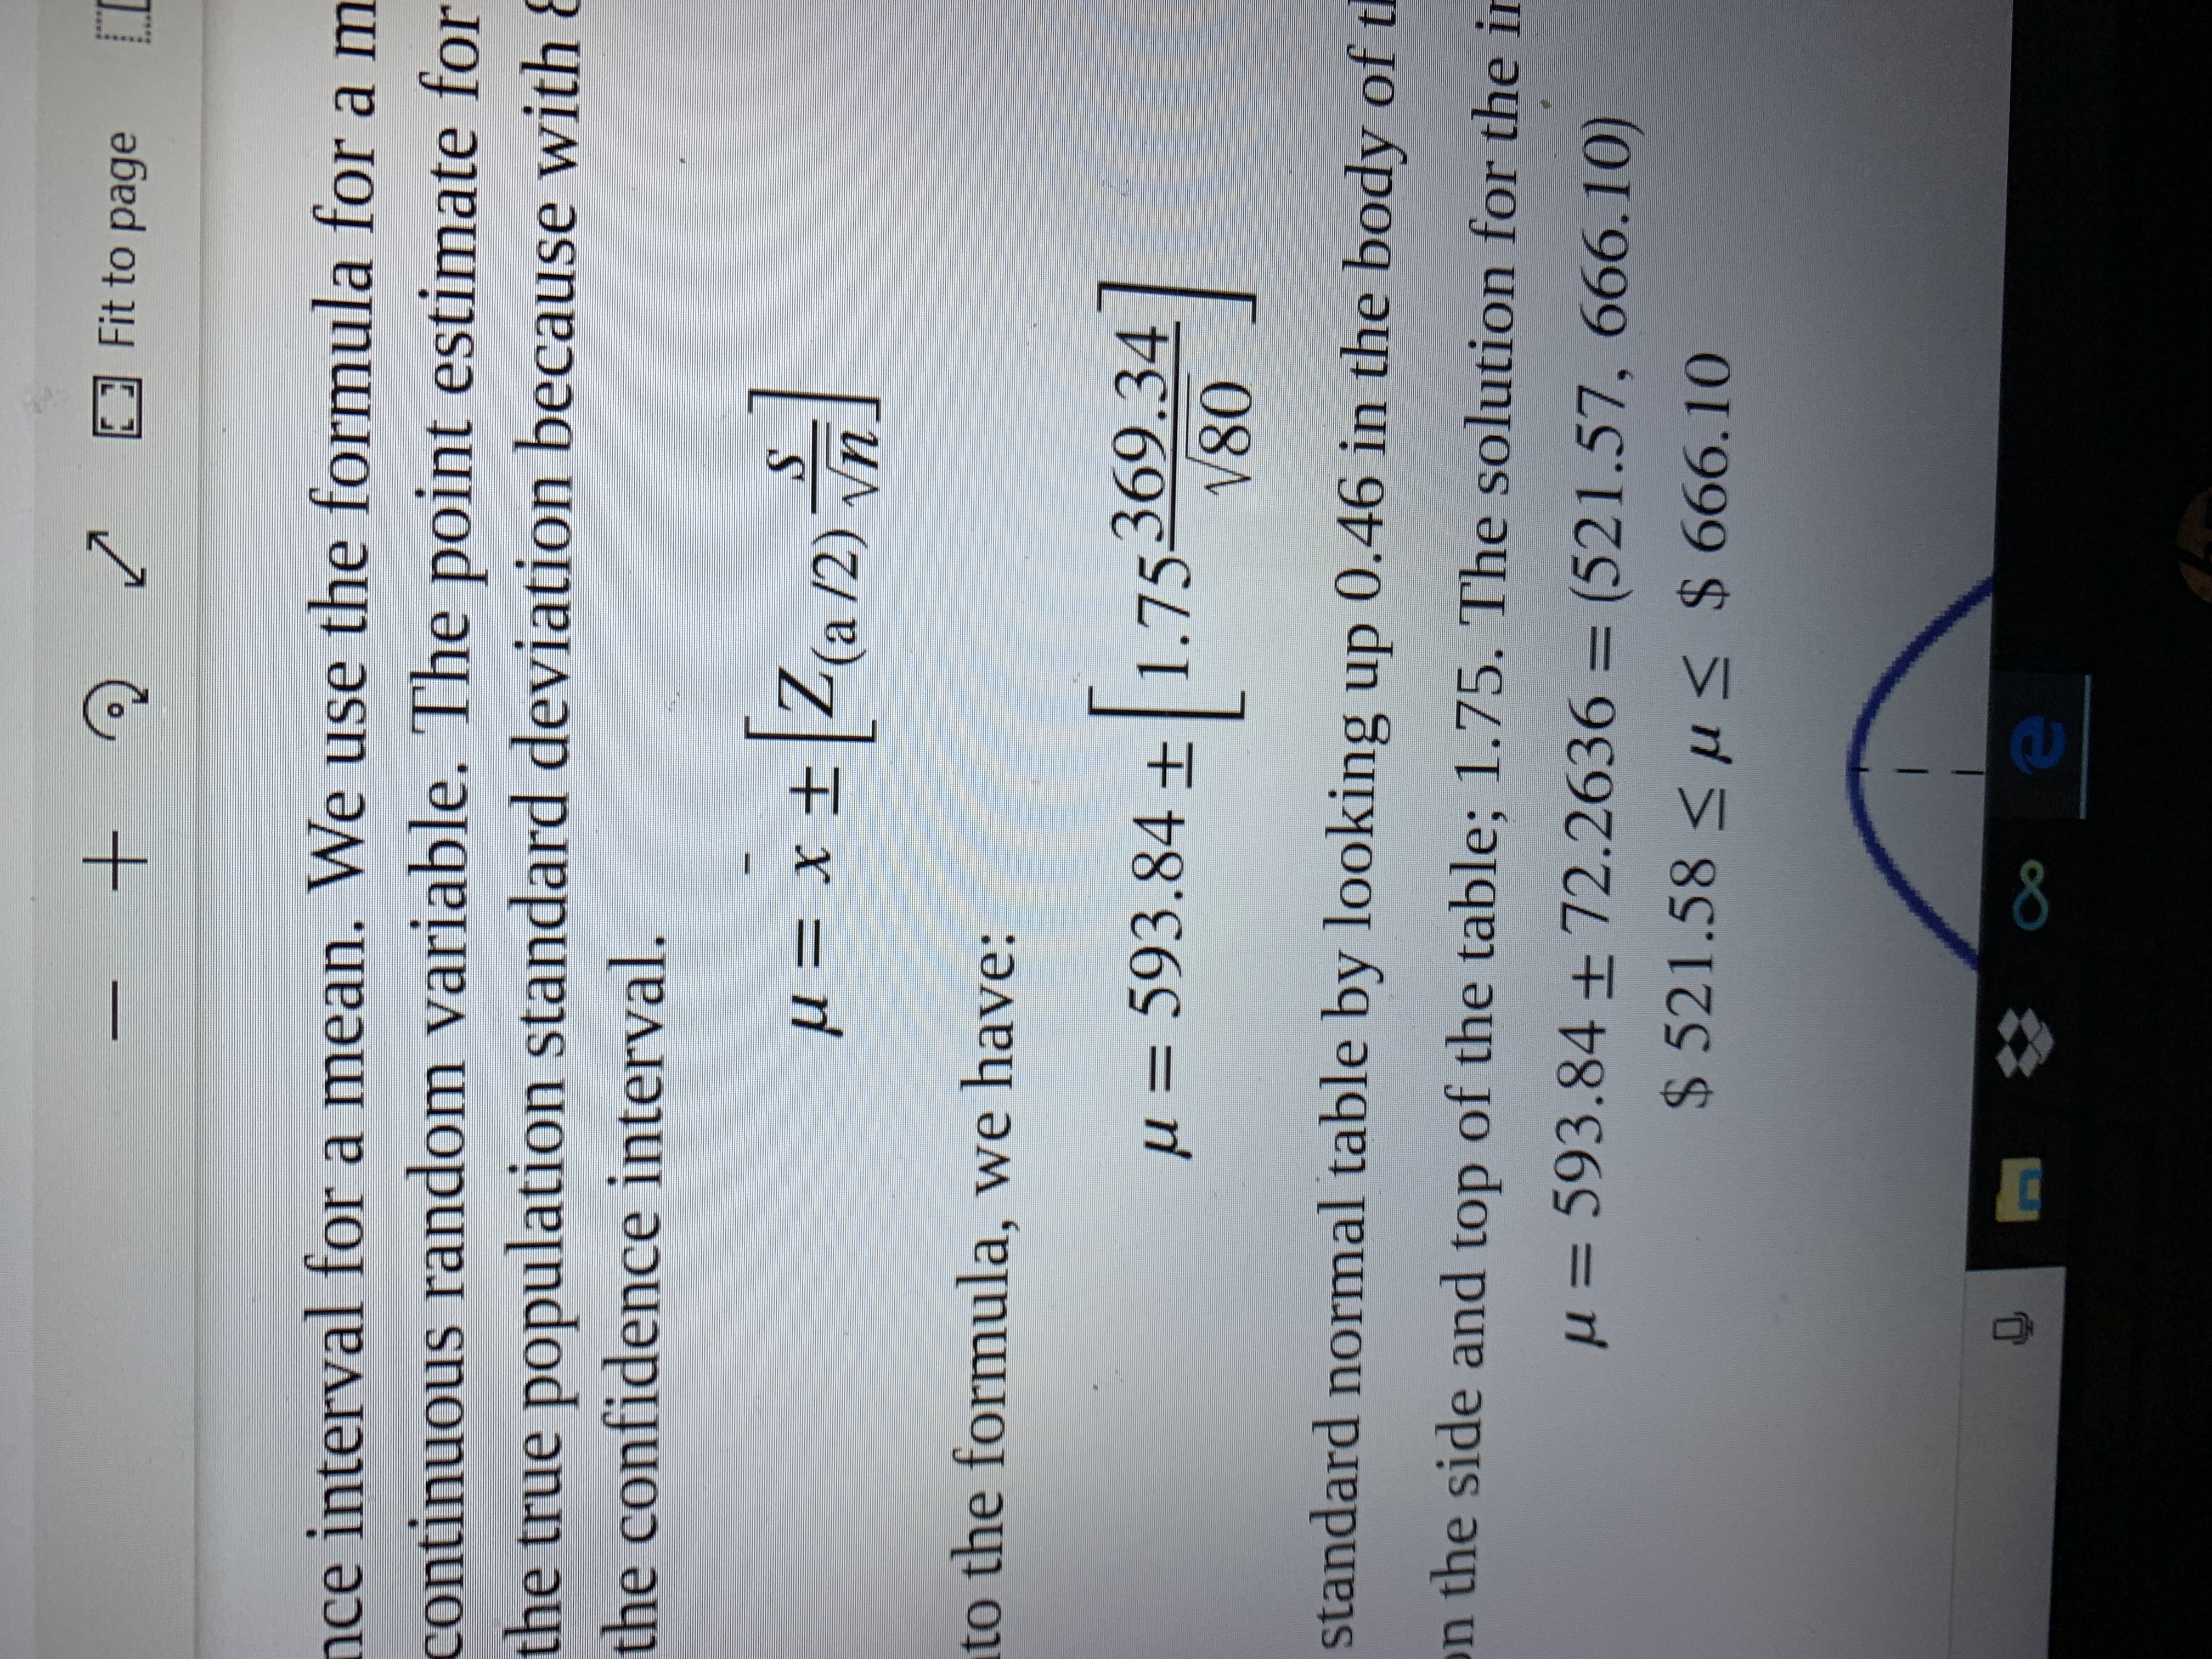
nce interval for a mean. We use the formula for a m
continuous random variable. The point estimate for
the true population standard deviation because with 8
the confidence interval.
xt(a/2)
Vn
to the formula, we have:
593.84 +1.75369.34
V80
и
standard normal table by looking up 0.46 in the body of t
n the side and top of the table; 1.75. The solution for the in
= 593.84 + 72.2636 = (521 .57, 666.10)
u
$ 521.58< u
$ 666.10
8
Expert Solution
This question has been solved!
Explore an expertly crafted, step-by-step solution for a thorough understanding of key concepts.

This is a popular solution

Trending nowThis is a popular solution!

Step by stepSolved in 2 steps with 2 images

Knowledge Booster


Learn more about
Need a deep-dive on the concept behind this application? Look no further. Learn more about this topic, statistics and related others by exploring similar questions and additional content below.Similar questions
- A poll showed that 385 out of 700 adults said they would be interested in traveling to outer space if given the chance. Create a 95% confidence interval for the true proportion of adults who would travel to space. Enter the lower endpoint of your interval in the first blank and the upper endpoint in the second blank. Enter your answers as decimals rounded to 4 places. Do not round intermediate steps.arrow_forwardShawn Spencer says the average number of homicides in New York is more than 884 per year. Adrian Monk disagrees, so Shawn decides to perform a hypothesis test with a significance level of 2%. Knowing that the standard deviation is 14.5 he has enough money to survey 62 people.Adrian says the actual average is 890 homicides per year. If Adrian is right what will be the power of Shawn's test?Use 4 decimalsarrow_forwardWhat are the z-scores for 90%, 95%, and 99% confidence?arrow_forward
- List below are the speeds (mi/h) measured from the southbound traffic on I-280, the speed limit is 65 mph. 62, 61, 61, 57, 61, 54,59, 58, 59, 69, 60, and 67 1.Construct a 99% confidence Interval 2. Construct a 90% interval 3. Explain what happen to the width of the confidence interval as the confidence level decreasesarrow_forwardDescribe about the INTERPRETATION OF A CONFIDENCE INTERVAL.arrow_forwardJust B pleasearrow_forward
- Nabisco claims that Chip Ahoy Cookies have an x ̅=28.67 chocolate chips per cookie with a SD=2.67. You randomly select 36 cookies from a new bag and carefully remove all the chocolate chips from each of the 36 cookies. You find the mean of the chocolate chips for the 36 cookies is 24.27 chocolate chips per cookie. Calculate the standard error for the chocolate chips in your experiment. (round to the nearest hundredth).arrow_forwardConstruct a 96% confidence interval if x=75 and n=200. Round your answers to 3 decimal places.arrow_forwardA poll of 1070 U.S. adults found that 563 U.S. adults, or 52.617% regularly used Facebook as a news source. Find the margin of error and confidence interval for the percentage of U.S. adults who regularly use Facebook as a news source, at the 90% level of confidence. Express all answers as percentages rounded to 2 decimal places. Do not write the percent sign. Margin of Error (as a percentage): Confidence Interval: Margin of Error (as a percentage): Confidence Interval: Now find the margin of error and confidence interval for the percentage of U.S. adults who regularly use Facebook as a news source, at the 95% level of confidence. Margin of Error (as a percentage): Confidence Interval: % to O increases O stays roughly the same O decreases % to Finally, find the margin of error and confidence interval for the percentage of U.S. adults who regularly use Facebook as a news source, at the 99% level of confidence. and the precision of our estimate O decreases O increases O stays roughly the…arrow_forward
arrow_back_ios
arrow_forward_ios
Recommended textbooks for you
- MATLAB: An Introduction with ApplicationsStatisticsISBN:9781119256830Author:Amos GilatPublisher:John Wiley & Sons Inc
 Probability and Statistics for Engineering and th...StatisticsISBN:9781305251809Author:Jay L. DevorePublisher:Cengage Learning
 Statistics for The Behavioral Sciences (MindTap C...StatisticsISBN:9781305504912Author:Frederick J Gravetter, Larry B. WallnauPublisher:Cengage Learning
  Elementary Statistics: Picturing the World (7th E...StatisticsISBN:9780134683416Author:Ron Larson, Betsy FarberPublisher:PEARSON
 The Basic Practice of StatisticsStatisticsISBN:9781319042578Author:David S. Moore, William I. Notz, Michael A. FlignerPublisher:W. H. Freeman
 Introduction to the Practice of StatisticsStatisticsISBN:9781319013387Author:David S. Moore, George P. McCabe, Bruce A. CraigPublisher:W. H. Freeman
MATLAB: An Introduction with Applications
Statistics
ISBN:9781119256830
Author:Amos Gilat
Publisher:John Wiley & Sons Inc
Probability and Statistics for Engineering and th...
Statistics
ISBN:9781305251809
Author:Jay L. Devore
Publisher:Cengage Learning
Statistics for The Behavioral Sciences (MindTap C...
Statistics
ISBN:9781305504912
Author:Frederick J Gravetter, Larry B. Wallnau
Publisher:Cengage Learning
Elementary Statistics: Picturing the World (7th E...
Statistics
ISBN:9780134683416
Author:Ron Larson, Betsy Farber
Publisher:PEARSON
The Basic Practice of Statistics
Statistics
ISBN:9781319042578
Author:David S. Moore, William I. Notz, Michael A. Fligner
Publisher:W. H. Freeman
Introduction to the Practice of Statistics
Statistics
ISBN:9781319013387
Author:David S. Moore, George P. McCabe, Bruce A. Craig
Publisher:W. H. Freeman