MATLAB: An Introduction with Applications
6th Edition
ISBN: 9781119256830
Author: Amos Gilat
Publisher: John Wiley & Sons Inc
expand_more
expand_more
format_list_bulleted
Topic Video
Question

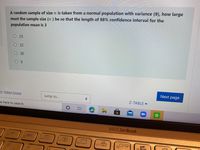
Transcribed Image Text:A random sample of size n is taken from a normal population with variance (9), how large
must the sample size (n ) be so that the length of 98% confidence interval for the
population mean is 3
O25
O22
O 30
Next page
D-TERM EXAM
Jump to...
Z-TABLE -
pe here to search
ASUS ZenBook
13)
f5
17
f6
foi
Expert Solution
This question has been solved!
Explore an expertly crafted, step-by-step solution for a thorough understanding of key concepts.
Step by stepSolved in 2 steps with 2 images

Knowledge Booster
Learn more about
Need a deep-dive on the concept behind this application? Look no further. Learn more about this topic, statistics and related others by exploring similar questions and additional content below.Similar questions
- There are four numbers in a data set. They are 5, 3, 7, and 11. a) What is the ∑∑ x2x2 b) What is the (∑x)2(∑x)2 c) The formula for the population variance, σ2σ2 is ∑x2−(∑x)2nn∑x2-(∑x)2nn Use parts a and b to help calculate the population variance. d. Now get the population standard deviation.arrow_forwardFor a random sample of 36 data pairs, the sample mean of the differences was 0.77. The sample standard deviation of the differences was 2. At the 5% level of significance, test the claim that the population mean of the differences is different from 0.arrow_forwardPavanarrow_forward
- A researcher is trying to estimate the population mean for a certain set of data. The sample mean is 20, and the error bound for the mean is 7, at a 68% confidence level. (So, x¯=20 and EBM = 7.) Find and interpret the confidence interval estimate.arrow_forwardSuppose scores on exams in Statistics are normally distributed with an unknown population mean and a sample standard deviation of 3 points. A random sample of scores with sample size equal to 36 gives a sample mean of 68. Find a confidence interval (CI) estimate for the population mean exam score for a) 90% CI and b) 95% CI, separately.arrow_forwardConstruct a confidence interval for p₁ - P2₂ at the given level of confidence. x₁ = 30, n₁ = 228, x₂ = 39, n₂ = 294, 95% confidence The researchers are % confident the difference between the two population proportions, p₁ – P2, is between (Use ascending order. Type an integer or decimal rounded to three decimal places as needed.) andarrow_forward
- Construct a confidence interval for p, - p, at the given level of confidence. X1 = 398, n1 = 543, x2 = 408, n2 = 578, 99% confidence The researchers are % confident the difference between the two population proportions, p, - p2, is between and (Use ascending order. Type an integer or decimal rounded to three decimal places as needed.)arrow_forwardA sample of 64 is taken from a population, with the mean of the sample being 119 and the standard deviation of the sample being 16. What is the 99.7% confidence interval for the mean of the population? OA. (115, 123) OB. (113, 125) OC. (118, 120) D. (117, 121)arrow_forwardConstruct a confidence interval for P₁-P₂ at the given level of confidence. X₁ = 369, n₁ = 508, X₂ = 426, n₂ = 599, 95% confidence % The researchers are confident the difference between the two population proportions, P₁-P₂, is between and (Use ascending order. Type an integer or decimal rounded to three decimal places as needed.)arrow_forward
arrow_back_ios
arrow_forward_ios
Recommended textbooks for you
 MATLAB: An Introduction with ApplicationsStatisticsISBN:9781119256830Author:Amos GilatPublisher:John Wiley & Sons Inc
 Probability and Statistics for Engineering and th...StatisticsISBN:9781305251809Author:Jay L. DevorePublisher:Cengage Learning
 Statistics for The Behavioral Sciences (MindTap C...StatisticsISBN:9781305504912Author:Frederick J Gravetter, Larry B. WallnauPublisher:Cengage Learning
 Elementary Statistics: Picturing the World (7th E...StatisticsISBN:9780134683416Author:Ron Larson, Betsy FarberPublisher:PEARSON
 The Basic Practice of StatisticsStatisticsISBN:9781319042578Author:David S. Moore, William I. Notz, Michael A. FlignerPublisher:W. H. Freeman
 Introduction to the Practice of StatisticsStatisticsISBN:9781319013387Author:David S. Moore, George P. McCabe, Bruce A. CraigPublisher:W. H. Freeman

MATLAB: An Introduction with Applications
Statistics
ISBN:9781119256830
Author:Amos Gilat
Publisher:John Wiley & Sons Inc

Probability and Statistics for Engineering and th...
Statistics
ISBN:9781305251809
Author:Jay L. Devore
Publisher:Cengage Learning

Statistics for The Behavioral Sciences (MindTap C...
Statistics
ISBN:9781305504912
Author:Frederick J Gravetter, Larry B. Wallnau
Publisher:Cengage Learning

Elementary Statistics: Picturing the World (7th E...
Statistics
ISBN:9780134683416
Author:Ron Larson, Betsy Farber
Publisher:PEARSON

The Basic Practice of Statistics
Statistics
ISBN:9781319042578
Author:David S. Moore, William I. Notz, Michael A. Fligner
Publisher:W. H. Freeman

Introduction to the Practice of Statistics
Statistics
ISBN:9781319013387
Author:David S. Moore, George P. McCabe, Bruce A. Craig
Publisher:W. H. Freeman