
MATLAB: An Introduction with Applications
6th Edition
ISBN: 9781119256830
Author: Amos Gilat
Publisher: John Wiley & Sons Inc
expand_more
expand_more
format_list_bulleted
Related questions
Question
Calculate the 90% confidence interval of β3. Interpret the answer.
^. ^. ^. ^
Pr[β3−se(β3)⋅t ≤ β3 ≤ β3 +se (β3)⋅t]=1−α
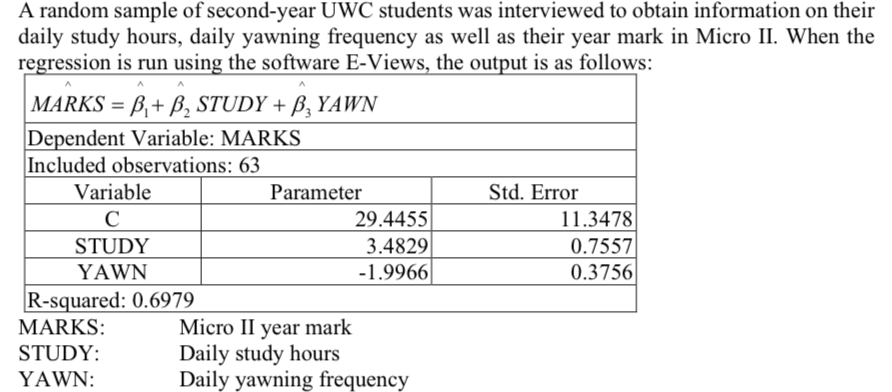

Transcribed Image Text:A random sample of second-year UWC students was interviewed to obtain information on their
daily study hours, daily yawning frequency as well as their year mark in Micro II. When the
regression is run using the software E-Views, the output is as follows:
|MARKS = B₁+ B₂ STUDY + B, YAWN
Dependent Variable: MARKS
Included observations: 63
Variable
C
STUDY
YAWN
R-squared: 0.6979
MARKS:
STUDY:
YAWN:
Parameter
29.4455
3.4829
-1.9966
Micro II year mark
Daily study hours
Daily yawning frequency
Std. Error
11.3478
0.7557
0.3756

Transcribed Image Text:Degrees
of
0.25
freedom 0.50
1.000
0.816
0.765
0.741
0.727
0.718
0.711
1
2
3
4
5
6
7
KUHESHSHESPANHA482
9
10
11
12
13
14
15
16
17
18
19
20
21
22
23
25
26
27
29
30
40
60
120
00
0.706
0.703
0.700
0.697
0.695
0.694
0.692
0.691
0.690
0.689
0.688
0.688
0.687
0.686
0.686
0.685
0.685
0.684
0.684
0.684
0.683
0.683
0.683
0.681
0.679
0.677
0.674
Percentage points of the t-distribution
0.10
0.20
3.078
1.886
1.638
1.533
1.476
1.440
1.415
1.397
1.383
1.372
1.363
1.356
1.350
1.345
1.341
1.337
1.333
1.330
1.328
1.325
1.323
1.321
1.319
1.318
1.316
1.315
1.314
1.313
1.311
1.310
1.303
1.296
1.289
1.282
0.05
0.10
6.314
2.920
2.353
2.132
2.015
1.943
1.895
1.860
1.833
1.812
1.796
1.782
1.771
1.761
1.753
1.746
1.740
1.734
1.729
1.725
1.721
1.717
1.714
1.711
1.708
1.706
1.703
1.701
1.699
1.697
1.684
1.671
1.658
1.645
t(p.df)
Alpha
0.025
0.01
0.050
0.02
12.706 31.821
4.303
6.965
3.182
4.541
2.776
3.747
2.571
3.365
2.447
3.143
2.365
2.998
2.896
2.821
2.764
2.718
2.681
2.650
2.624
2.602
2.583
2.567
2.552
2.539
2.528
2.518
2.508
2.306
2.262
2.228
2.201
2.179
2.160
2.145
2.131
2.120
2.110
2.101
2.093
2.086
2.080
2.074
2.069
2.064
2.060
2.056
2.052
2.048
2.045
2.042
2.021
2.000
1.980
1.960
2.500
2.492
2.485
2.479
2.473
2.467
2.462
2.457
2.423
2.390
2.358
2.326
0.005
0.010
63.657
9.925
5.841
4.604
4.032
3.707
3.499
3.355
3.250
3.169
3.106
3.055
3.012
2.977
2.947
2.921
2.898
2.878
2.861
2.845
2.831
2.819
2.807
2.797
2.787
2.779
2.771
2.763
2.756
2.750
2.704
2.660
2.617
2.576
0.001
0.002
318.310
22.327
1.214
7.173
5.893
5.208
4.785
4.501
4.297
4.144
4.025
3.930
3.852
3.787
3.733
3.686
3.646
3.610
3.579
3.552
3.527
3.505
3.485
3.467
3.450
3.435
3.421
3.408
3.396
3.385
3.307
3.232
3.160
3.090
Expert Solution
This question has been solved!
Explore an expertly crafted, step-by-step solution for a thorough understanding of key concepts.

Step by stepSolved in 2 steps with 1 images

Knowledge Booster

Similar questions
- A new cream that advertises that it can reduce wrinkles and improve skin was subject to a recent study. A sample of 54 women over the age of 50 used the new cream for 6 months. Of those 54 women, 43 of them reported skin improvement(as judged by a dermatologist). Is this evidence that the cream will improve the skin of more than 60% of women over the age of 50? Test using α=0.05. test statistics z= The final conclustion is A. There is not sufficient evidence to reject the null hypothesis that p=0.6. That is, there is not sufficient evidence to reject that the cream can improve the skin of more than 60% of women over 50.B. We can reject the null hypothesis that p=0.6 and accept that p>0.6. That is, the cream can improve the skin of more than 60% of women over 50.arrow_forward9) Find L3.2 (5) using the nodes xo = 3,x1 = 4, x2 = 6 ,x3 = 8 %3Darrow_forwardSuppose I estimate the following regression models with BP test p-values: == Y₁ =α0+α1Xi+ei Y₁ = ßo + B₁Xi + ß2X ² + vi pval = 0.76 p val = 0.056 pval = 0.00013 Y₁ = 00 + 01Xi + 02X² +03X3 + Zi At the 5% level, which functional form(s) seem(s) appropriate to describe the relationship between Yi and Xi. (a) Form (1) only (b) Form (3) only (c) Form (1) and (2) only (d) Form (1) and (3) only (e) Form (1), (2) and (3) (1)arrow_forward
- A medical researcher says that less than 85% of adults in a certain country think that healthy children should be required to be vaccinated. In a random sample of 300 adults in that country, 83% think that healthy children should be required to be vaccinated. At α=0.01, is there enough evidence to support the researcher's claim? Complete parts (a) through (e) below. (a) Identify the claim and state H0 and Ha. Identify the claim in this scenario. Select the correct choice below and fill in the answer box to complete your choice. (Type an integer or a decimal. Do not round.) A. Less than 8585% of adults in the country think that healthy children should be required to be vaccinated. Your answer is correct. B. The percentage of adults in the country who think that healthy children should be required to be vaccinated is not enter your response here%. C. More than enter your response here% of adults in the country think that healthy children…arrow_forwardA medical researcher says that less than 86% of adults in a certain country think that healthy children should be required to be vaccinated. In a random sample of 300 adults in that country, 84% think that healthy children should be required to be vaccinated. At α=0.05, is there enough evidence to support the researcher's claim? Complete parts (a) through (e) below. (a) Identify the claim and state H0 and Ha. Identify the claim in this scenario. Select the correct choice below and fill in the answer box to complete your choice. (Type an integer or a decimal. Do not round.) A. Less than 8686% of adults in the country think that healthy children should be required to be vaccinated. B. The percentage of adults in the country who think that healthy children should be required to be vaccinated is not nothing%. C. nothing% of adults in the country think that healthy children should be required to be vaccinated. D. More than nothing%…arrow_forwardA medical researcher says that less than 85% of adults in a certain country think that healthy children should be required to be vaccinated. In a random sample of 300 adults in that country, 83% think that healthy children should be required to be vaccinated. At α=0.01, is there enough evidence to support the researcher's claim? Complete parts (a) through (e) below. (a) Identify the claim and state H0 and Ha. Identify the claim in this scenario. Select the correct choice below and fill in the answer box to complete your choice. (Type an integer or a decimal. Do not round.) A. Less than enter your response here% of adults in the country think that healthy children should be required to be vaccinated. B. The percentage of adults in the country who think that healthy children should be required to be vaccinated is not enter your response here%. C. More than enter your response here% of adults in the country think that healthy children…arrow_forward
arrow_back_ios
arrow_forward_ios
Recommended textbooks for you
- MATLAB: An Introduction with ApplicationsStatisticsISBN:9781119256830Author:Amos GilatPublisher:John Wiley & Sons Inc
 Probability and Statistics for Engineering and th...StatisticsISBN:9781305251809Author:Jay L. DevorePublisher:Cengage Learning
 Statistics for The Behavioral Sciences (MindTap C...StatisticsISBN:9781305504912Author:Frederick J Gravetter, Larry B. WallnauPublisher:Cengage Learning
  Elementary Statistics: Picturing the World (7th E...StatisticsISBN:9780134683416Author:Ron Larson, Betsy FarberPublisher:PEARSON
 The Basic Practice of StatisticsStatisticsISBN:9781319042578Author:David S. Moore, William I. Notz, Michael A. FlignerPublisher:W. H. Freeman
 Introduction to the Practice of StatisticsStatisticsISBN:9781319013387Author:David S. Moore, George P. McCabe, Bruce A. CraigPublisher:W. H. Freeman
MATLAB: An Introduction with Applications
Statistics
ISBN:9781119256830
Author:Amos Gilat
Publisher:John Wiley & Sons Inc
Probability and Statistics for Engineering and th...
Statistics
ISBN:9781305251809
Author:Jay L. Devore
Publisher:Cengage Learning
Statistics for The Behavioral Sciences (MindTap C...
Statistics
ISBN:9781305504912
Author:Frederick J Gravetter, Larry B. Wallnau
Publisher:Cengage Learning
Elementary Statistics: Picturing the World (7th E...
Statistics
ISBN:9780134683416
Author:Ron Larson, Betsy Farber
Publisher:PEARSON
The Basic Practice of Statistics
Statistics
ISBN:9781319042578
Author:David S. Moore, William I. Notz, Michael A. Fligner
Publisher:W. H. Freeman
Introduction to the Practice of Statistics
Statistics
ISBN:9781319013387
Author:David S. Moore, George P. McCabe, Bruce A. Craig
Publisher:W. H. Freeman