MATLAB: An Introduction with Applications
6th Edition
ISBN: 9781119256830
Author: Amos Gilat
Publisher: John Wiley & Sons Inc
expand_more
expand_more
format_list_bulleted
Topic Video
Question
A random sample of n1 = 10 regions in New England gave the following violent crime rates (per million population).
What is the value of the sample test statistic? (Test the difference ?1 − ?2. Round your answer to three decimal places.)

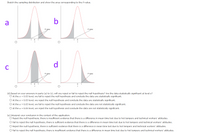
Transcribed Image Text:Sketch the sampling distribution and show the area corresponding to the P-value.
a
b
P.value
P-value
-t 0
d
P-value
P-value
-t o
(d) Based on your answers in parts (a) to (c), will you reject or fail to reject the null hypothesis? Are the data statistically significant at level a?
O At the a = 0.05 level, we fail to reject the null hypothesis and conclude the data are statistically significant.
O At the a = 0.05 level, we reject the null hypothesis and conclude the data are statistically significant.
At the a = 0.05 level, we fail to reject the null hypothesis and conclude the data are not statistically significant.
O At the a = 0.05 level, we reject the null hypothesis and conclude the data are not statistically significant.
(e) Interpret your conclusion in the context of the application.
O Reject the null hypothesis, there is insufficient evidence that there is a difference in mean time lost due to hot tempers and technical workers' attitudes.
O Fail to reject the null hypothesis, there is sufficient evidence that there is a difference in mean time lost due to hot tempers and technical workers' attitudes.
O Reject the null hypothesis, there is sufficient evidence that there is a difference in mean time lost due to hot tempers and technical workers' attitudes.
O Fail to reject the null hypothesis, there is insufficient evidence that there is a difference in mean time lost due to hot tempers and technical workers' attitudes.

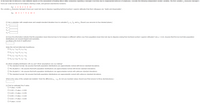
Transcribed Image Text:In her book Red Ink Behaviors, Jean Hollands reports on the assessment of leading Silicon Valley companies regarding a manager's lost time due to inappropriate behavior of employees. Consider the following independent random variables. The first variable x, measures manager's
hours per week lost due to hot tempers, flaming e-mails, and general unproductive tensions.
x: 1 5 8 2 2 4 10
The variable x, measures manager's hours per week lost due to disputes regarding technical workers' superior attitudes that their colleagues are "dumb and dispensable".
X,: 10 5 2 7 9 4 10 3
) Use a calculator with sample mean and sample standard deviation keys to calculate x,, s,, X2, and s,. (Round your answers to four decimal places.)
x =
s, =
x =
S2 =
(i) Does the information indicate that the population mean time lost due to hot tempers is different (either way) from population mean time lost due to disputes arising from technical workers' superior attitudes? Use a = 0.05. Assume that the two lost-time population
distributions are mound-shaped and symmetric.
(a) What is the level of significance?
State the null and alternate hypotheses.
O Ho: H1 = H2i H;: Hq # H2
O Ho: H1 = H2; H,: H1 > H2
Ο H μ- μ2) Ηλ' με < μ2.
O Ho: H1# Hz; H 1: H1 = H2
(b) What sampling distribution will you use? What assumptions are you making?
O The standard normal. We assume that both population distributions are approximately normal with known standard deviations.
O The Student's t. We assume that both population distributions are approximately normal with known standard deviations.
O The Student's t. We assume that both population distributions are approximately normal with unknown standard deviations.
O The standard normal. We assume that both population distributions are approximately normal with unknown standard deviations.
What is the value of the sample test statistic? (Test the difference u, - p,. Do not use rounded values. Round your final answer to three decimal places.)
(c) Find (or estimate) the P-value.
O P-value > 0.500
O 0.250 < P-value < 0.500
O 0.100 < P-value < 0.250
O 0.050 < Pp-value < 0.100
O 0.010 < P-value < 0.050
O P-value < 0.010
Expert Solution
This question has been solved!
Explore an expertly crafted, step-by-step solution for a thorough understanding of key concepts.
Step by stepSolved in 2 steps with 1 images

Knowledge Booster
Learn more about
Need a deep-dive on the concept behind this application? Look no further. Learn more about this topic, statistics and related others by exploring similar questions and additional content below.Similar questions
- Find the standardized test , z to test the claim that p1 = p2. The sample statistics listed below are from independent samples.arrow_forwardGiven the mean and SD of the eight forms of employment in PEAR INC., calculate the z-scores for the individuals who took the exams in the different countries. ROUND Z-SCORES TO THREE DECIMAL PLACES; WRITE Z-SCORES WITH A SIGN (ex. -1.204 for negative z-score and +1.204 for positive) Description Quiz 11: Z-Scores ROUND Z-SCORES TO THREE DECIMAL PLACES (to the nearest thousandth). EACH Z-SCORE SHOULD HAVE A + OR - SIGN IN FRONT TO INDICATE POSITIVE OR NEGATIVE VALUE. Use the data below: Eight forms of an employment exam (one in each country of expansion) are given by PEAR INC. The overall (population) mean and standard deviations of these eight forms are found in the table below. TEST LOCATION MEAN ( ) Standard Deviation ( ) Argentina 82 7 Belgium 39 3.5 China 125 11.5 Denmark 60 5.2 Egypt 92 8.5 France 420 36 Greece 160 14.5 Holland 75 6.5 1. Egypt mean = 92; SD = 8.5 Emir took the test in Egypt and scored 90; Emir's Z-score is:…arrow_forwardYou are testing the claim that the proportion of men who own cats is smaller than the proportion of women who own cats.You sample 190 men, and 71 own cats.You sample 130 women, and 114 own cats.Find the test statistic, rounded to two decimal placesarrow_forward
- The scores on the Wechsler Adult Intelligence Scale are approximately Normal, with ?=100 and ?=15 . The score needed to be among the highest 10% of all scores is closest to:arrow_forwardThe claim is that the proportion of adults who smoked a cigarette in the past week is less than 0.35 and the sample statistics include n =1600 subjects with 576 saying that they smoked cigarette in the past week .Find the value of the test statistics ?arrow_forwardSuppose a random sample of n = 350 teenagers 13 to 17 years of age was asked if they use social media. Of those surveyed, 280 stated that they do use social media. Find the sample proportion of teenagers 13 to 17 years of age who use social media. The sample proportion is p= (Round to three decimal places as needed.) ...arrow_forward
- You want to compare differences in prior arrests across ethnicity in your study, you measured ethnicity as white =0 black =1 hispanic=2, and other =3. Prior arrests was recorded as the number of prior arrests. which test would you perform to see if arrests differ across diffrent ethnic categories? A. ANOVA B. T-testarrow_forwardAn independent measures study with n = 6 in each sample produces a sample mean difference of 8 points and Sm1-m2= 2. What is the value for the T statistic? A. 1 B. 2 C. 4 D. 4/-8arrow_forwardThe claim is that the proportion of peas with yellow pods is equal to 0.25 (or 25%). The sample statistics from one experiment include 450 peas with 117 of them having yellow pods. Find the value of the test statistic.arrow_forward
arrow_back_ios
arrow_forward_ios
Recommended textbooks for you
 MATLAB: An Introduction with ApplicationsStatisticsISBN:9781119256830Author:Amos GilatPublisher:John Wiley & Sons Inc
 Probability and Statistics for Engineering and th...StatisticsISBN:9781305251809Author:Jay L. DevorePublisher:Cengage Learning
 Statistics for The Behavioral Sciences (MindTap C...StatisticsISBN:9781305504912Author:Frederick J Gravetter, Larry B. WallnauPublisher:Cengage Learning
 Elementary Statistics: Picturing the World (7th E...StatisticsISBN:9780134683416Author:Ron Larson, Betsy FarberPublisher:PEARSON
 The Basic Practice of StatisticsStatisticsISBN:9781319042578Author:David S. Moore, William I. Notz, Michael A. FlignerPublisher:W. H. Freeman
 Introduction to the Practice of StatisticsStatisticsISBN:9781319013387Author:David S. Moore, George P. McCabe, Bruce A. CraigPublisher:W. H. Freeman

MATLAB: An Introduction with Applications
Statistics
ISBN:9781119256830
Author:Amos Gilat
Publisher:John Wiley & Sons Inc

Probability and Statistics for Engineering and th...
Statistics
ISBN:9781305251809
Author:Jay L. Devore
Publisher:Cengage Learning

Statistics for The Behavioral Sciences (MindTap C...
Statistics
ISBN:9781305504912
Author:Frederick J Gravetter, Larry B. Wallnau
Publisher:Cengage Learning

Elementary Statistics: Picturing the World (7th E...
Statistics
ISBN:9780134683416
Author:Ron Larson, Betsy Farber
Publisher:PEARSON

The Basic Practice of Statistics
Statistics
ISBN:9781319042578
Author:David S. Moore, William I. Notz, Michael A. Fligner
Publisher:W. H. Freeman

Introduction to the Practice of Statistics
Statistics
ISBN:9781319013387
Author:David S. Moore, George P. McCabe, Bruce A. Craig
Publisher:W. H. Freeman