MATLAB: An Introduction with Applications
6th Edition
ISBN: 9781119256830
Author: Amos Gilat
Publisher: John Wiley & Sons Inc
expand_more
expand_more
format_list_bulleted
Concept explainers
Topic Video
Question

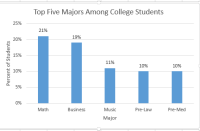
Transcribed Image Text:A random sample of 2334 college students were asked their major. The top five responses and the percentage of students who named
each of the top five majors are shown in the graph.
18Q15.PNG
Use the graph to answer the questions.
?
The margin of error is 2.1%.
We can be 95% confident that between
% and
% of students in the population are majoring in
math. (Use ascending order. Round to the nearest tenth as needed.)

Expert Solution
This question has been solved!
Explore an expertly crafted, step-by-step solution for a thorough understanding of key concepts.
This is a popular solution
Trending nowThis is a popular solution!
Step by stepSolved in 2 steps with 2 images

Knowledge Booster
Learn more about
Need a deep-dive on the concept behind this application? Look no further. Learn more about this topic, statistics and related others by exploring similar questions and additional content below.Similar questions
- Graph the inverse of the provided graph on the accompanying set of axes. You must plot at least 5 points. *Click the graph to make a point. Click it again to erase.* 1 2 3 4 56 7arrow_forwardConsider the woman's 100 Your - and the subsequent 100 meter - in the Olympics since records have been kept determined the best way to combine all the data in depict the data would you use a histogram A-line graph a stem and leaf plot or a scatterplotarrow_forwardJeff took 15 quizzes in his Calculus class. His quiz scores had the following 5 number summary. Based on this 5 number summary, are any of his quiz scores potentially an outlier? Min = 4 Q1 = 8 Median = 8.5 Q3 = 9 Max = 10arrow_forward
- Anna teaches a small class of 14 students. She recently gave them an exam (out of 100 points). The scores on the exam were: 0, 15, 58, 75, 78, 82, 84, 84, 89, 91, 94, 98, 100, and 100. How many of the scores are potential outliers? a. 1 b. 0 c. 3 d. 2 e. Impossible to Determinearrow_forwardFor some data, we know the range R of the data is 12 and its median is 6. Find Estimated Lowest Number, and Estimated Highest Number for this data. Give you answers in the same order asked.arrow_forwardThe state education commission wants to estimate the fraction of tenth grade students that have reading skills at or below the eighth grade level. Suppose a sample of 2552 tenth graders is drawn. Of the students sampled, 2119 read above the eighth grade level. Using the data, estimate the proportion of tenth graders reading at or below the eighth grade level. Enter your answer as a fraction or a decimal number rounded to three decimal places.arrow_forward
- A survey asked students what mode of transportation they normally use to get to school. The results are as follows: Bike 7, walk 29, bus 32, car 17. Represent this data in a circle graph.arrow_forwardThe data set available below represents the length of life, in seconds, of 50 fruit flies subject to a new spray in a controlled laboratory experiment. Comment on any outliers in the data. Click the icon to view the data. The data contains possible outlier(s). (Type a whole number.) Save Clear all Check answer /1)arrow_forwardThe table below represents a direct variation. Fill in each blank with the correct value for A, B, and C. Only type in the value. X y A = type your answer... 9 -3 ; B = type your answer... 12 A ;C= type your answer... B 0 -6 Carrow_forward
arrow_back_ios
arrow_forward_ios
Recommended textbooks for you
 MATLAB: An Introduction with ApplicationsStatisticsISBN:9781119256830Author:Amos GilatPublisher:John Wiley & Sons Inc
 Probability and Statistics for Engineering and th...StatisticsISBN:9781305251809Author:Jay L. DevorePublisher:Cengage Learning
 Statistics for The Behavioral Sciences (MindTap C...StatisticsISBN:9781305504912Author:Frederick J Gravetter, Larry B. WallnauPublisher:Cengage Learning
 Elementary Statistics: Picturing the World (7th E...StatisticsISBN:9780134683416Author:Ron Larson, Betsy FarberPublisher:PEARSON
 The Basic Practice of StatisticsStatisticsISBN:9781319042578Author:David S. Moore, William I. Notz, Michael A. FlignerPublisher:W. H. Freeman
 Introduction to the Practice of StatisticsStatisticsISBN:9781319013387Author:David S. Moore, George P. McCabe, Bruce A. CraigPublisher:W. H. Freeman

MATLAB: An Introduction with Applications
Statistics
ISBN:9781119256830
Author:Amos Gilat
Publisher:John Wiley & Sons Inc

Probability and Statistics for Engineering and th...
Statistics
ISBN:9781305251809
Author:Jay L. Devore
Publisher:Cengage Learning

Statistics for The Behavioral Sciences (MindTap C...
Statistics
ISBN:9781305504912
Author:Frederick J Gravetter, Larry B. Wallnau
Publisher:Cengage Learning

Elementary Statistics: Picturing the World (7th E...
Statistics
ISBN:9780134683416
Author:Ron Larson, Betsy Farber
Publisher:PEARSON

The Basic Practice of Statistics
Statistics
ISBN:9781319042578
Author:David S. Moore, William I. Notz, Michael A. Fligner
Publisher:W. H. Freeman

Introduction to the Practice of Statistics
Statistics
ISBN:9781319013387
Author:David S. Moore, George P. McCabe, Bruce A. Craig
Publisher:W. H. Freeman