
MATLAB: An Introduction with Applications
6th Edition
ISBN: 9781119256830
Author: Amos Gilat
Publisher: John Wiley & Sons Inc
expand_more
expand_more
format_list_bulleted
Related questions
Topic Video
Question
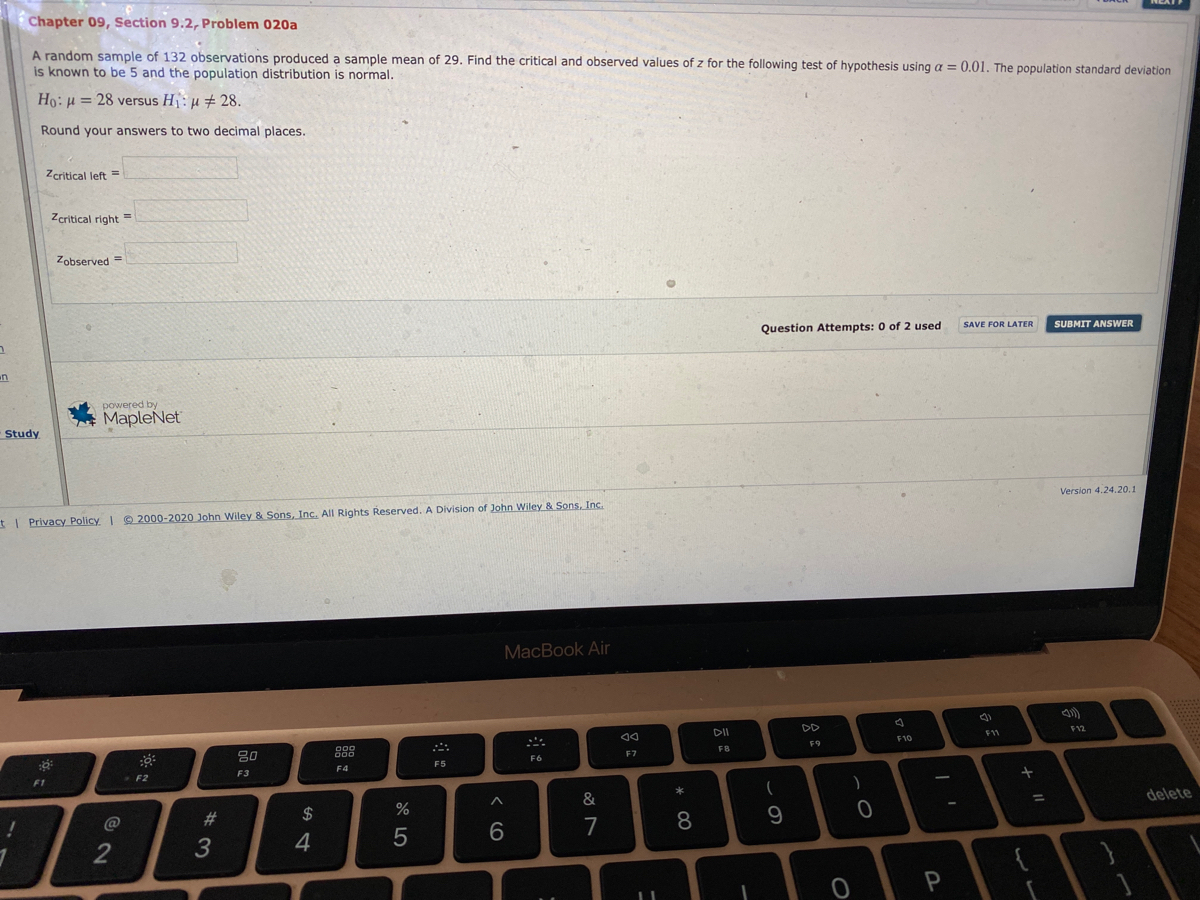

Transcribed Image Text:Chapter 09, Section 9.2, Problem 020a
A random sample of 132 observations produced a sample mean of 29. Find the critical and observed values of z for the following test of hypothesis using a = 0.01. The population standard deviation
is known to be 5 and the population distribution is normal.
Ho: H = 28 versus H:u # 28.
Round your answers to two decimal places.
Zcritical left =
Zcritical right =
Zobserved =
Question Attempts: 0 of 2 used
SAVE FOR LATER
SUBMIT ANSWER
un
powered by
MapleNet
Study
tI Privacy Policy I 2000-2020 John Wiley & Sons, Inc. All Rights Reserved. A Division of John Wiley & Sons, Inc.
Version 4.24.20.1
MacBook Air
DI
DD
888
F12
80
F9
F10
F11
FB
F5
F6
F7
F2
F3
F4
F1
&
@
#3
2$
delete
%3D
3
4
7
8
P
Expert Solution
This question has been solved!
Explore an expertly crafted, step-by-step solution for a thorough understanding of key concepts.

This is a popular solution

Trending nowThis is a popular solution!

Step by stepSolved in 2 steps with 1 images

Knowledge Booster


Learn more about
Need a deep-dive on the concept behind this application? Look no further. Learn more about this topic, statistics and related others by exploring similar questions and additional content below.Similar questions
- Can I have two positive numbers with a normal standard distribution? I'm stuck. Please help. Thank you.arrow_forwardA random sample of computer startup times has a sample mean of x¯=37.2 seconds, with a sample standard deviation of s=6.2 seconds. Since computer startup times are generally symmetric and bell-shaped, we can apply the Empirical Rule. Between what two times are approximately 95% of the data? Round your answer to the nearest tenth.arrow_forwardConsider two populations in the same state. Both populations are the same size (22,000). Population 1 consists of all students at the State university. Population 2 consists of all residents in a small town. Consider the variable Age. Which population would most likely have the largest standard deviation? They would likely have the same standard deviation(SD) for age because they have the same population size. O Population 2 would more likely have a higher standard deviation (SD) than Population 1. Population 1 would more likely have a higher standard deviation(SD) than Population 2 There is not enough information to tell.arrow_forward
- For men heights are normally distributed with a mean of 69 inches and a standard deviation of 2.8 inches. If samples of 25 men are selected at random from the population, would the average height found for each sample be more or less varied than the individual measurements taken for each man?Barrow_forwardBrewed decaffeinated coffee contains some caffeine. We want to estimațe the amount of caffeine in 8 ounce cups of decaf coffee at local fast food restaurants. For this question, assume that the standard deviation in the amount of caffeine in 8 ounces of decaf coffee is not known and is estimated to be 2.3 mg using the samplestandard deviation. This time we took a sample of n = 9 eight-ounce cups of coffee from fast food restaurants on Robert Street in West St. Paul. The sample mean amount of caffeine turned out to be 9 mg. Construct a 99% confidence interval estimate for the true mean amount of caffeine in eight-ounce cups of decaf coffee, using the new information described above. Type the formula for your confidence interval into the text box first and then type a second version where you fill in all of the numbers in your formula. You don't have to calculate the final numeric result.arrow_forwardThe average monthly, entry-level salary for fresh graduates was reported as $2,800. A recruiting agency believed that the mean salary of fresh entry is lower than this. The recruiting office randomly surveyed 25 entry-level graduates and found that the sample means salary is $2,200, and the sample standard deviation is $1800. Assuming t- distribution is followed, answer the following questions. Use: H0 : u>2800 H1 : uarrow_forward
- You take random sample of 200 people from Salinas and find that their average income is $48, 000 per ssalazar@stuce X year with a standard deviation of $9000. Also assume that population incomes are normally Email om sampile of 200 distributed. om sangle cf 200 X Approximately how many people make between $39,000 and $57,000? Uplead on sanple cf 200 X 200 O Cirf-I Answer format: Enter a positive integer Textarrow_forwardA coffee vending machine is adjusted so thatthe quantity of beverage poured is a normal variable ofaverage 200 ml. You buy 15 cups of coffee and you noticethat the average volume is 195 ml with a standard deviationof 2.3 ml. Can you file a complaint against the ownerof this machine for the lack of coffee in your glasses?Test at the 5% level.arrow_forwardIn a random sample of 6 cell phones, the mean full retail price was $547.30 and the standard deviation was $176.00. Further research suggests that the population mean is $428.25. Does the t-value for the original sample fall between and to.95? Assume that the population of full retail prices for cell phones is normally distributed. - to.95 The t-value of t = fall between -1 -to.95 and to. .95 because to 95 = (Round to two decimal places as needed.)arrow_forward
- State the conclusion based on the results of the test. The standard deviation in the pressure required to open a certain valve is known to be o = 0.8 psi. Due to changes in the manufacturing process, the quality-control manager feels that the pressure variability has increased. The null hypothesis was rejected. Choose the correct answer below. O A. There is sufficient evidence that the standard deviation in the pressure required to open a certain valve has increased. O B. There is not sufficient evidence that the standard deviation in the pressure required to open a certain valve has not changed. OC. The standard deviation in the pressure has not changed. O D. There is sufficient evidence that the standard deviation in the pressure required to open a certain valve has not changed. O E. The standard deviation in the pressure has increased. O F. There is not sufficient evidence that the standard deviation in the pressure required to open a certain valve has increased.arrow_forwardSee pictures for question D and E and (A, B and Cand was submitted on a different question. According to a report done by S & J Power, the mean lifetime of the light bulbs it manufactures is 44 months. A researcher for a consumer advocate group tests this by selecting 16 bulbs at random. For the bulbs in the sample, the mean lifetime is 47 months. It is known that the population standard deviation of the lifetimes is 5 months. Assume that the population is normally distributed. Can we conclude, at the 0.10 level of significance, that the population mean lifetime, μ, of light bulbs made by this manufacturer differs from 44 months? Perform a two-tailed test. Then complete the parts below. Carry your intermediate computations to three or more decimal places, and round your responses as specified below.arrow_forwardIf someone could help me answer this that would be great.arrow_forward
arrow_back_ios
arrow_forward_ios
Recommended textbooks for you
- MATLAB: An Introduction with ApplicationsStatisticsISBN:9781119256830Author:Amos GilatPublisher:John Wiley & Sons Inc
 Probability and Statistics for Engineering and th...StatisticsISBN:9781305251809Author:Jay L. DevorePublisher:Cengage Learning
 Statistics for The Behavioral Sciences (MindTap C...StatisticsISBN:9781305504912Author:Frederick J Gravetter, Larry B. WallnauPublisher:Cengage Learning
  Elementary Statistics: Picturing the World (7th E...StatisticsISBN:9780134683416Author:Ron Larson, Betsy FarberPublisher:PEARSON
 The Basic Practice of StatisticsStatisticsISBN:9781319042578Author:David S. Moore, William I. Notz, Michael A. FlignerPublisher:W. H. Freeman
 Introduction to the Practice of StatisticsStatisticsISBN:9781319013387Author:David S. Moore, George P. McCabe, Bruce A. CraigPublisher:W. H. Freeman
MATLAB: An Introduction with Applications
Statistics
ISBN:9781119256830
Author:Amos Gilat
Publisher:John Wiley & Sons Inc
Probability and Statistics for Engineering and th...
Statistics
ISBN:9781305251809
Author:Jay L. Devore
Publisher:Cengage Learning
Statistics for The Behavioral Sciences (MindTap C...
Statistics
ISBN:9781305504912
Author:Frederick J Gravetter, Larry B. Wallnau
Publisher:Cengage Learning
Elementary Statistics: Picturing the World (7th E...
Statistics
ISBN:9780134683416
Author:Ron Larson, Betsy Farber
Publisher:PEARSON
The Basic Practice of Statistics
Statistics
ISBN:9781319042578
Author:David S. Moore, William I. Notz, Michael A. Fligner
Publisher:W. H. Freeman
Introduction to the Practice of Statistics
Statistics
ISBN:9781319013387
Author:David S. Moore, George P. McCabe, Bruce A. Craig
Publisher:W. H. Freeman