
A First Course in Probability (10th Edition)
10th Edition
ISBN: 9780134753119
Author: Sheldon Ross
Publisher: PEARSON
expand_more
expand_more
format_list_bulleted
Related questions
Question
answer the following
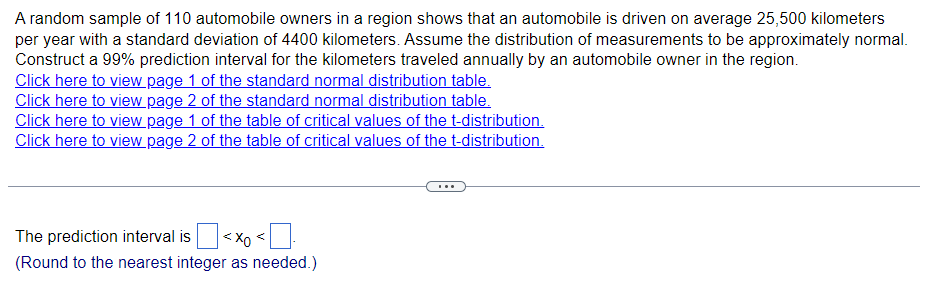

Transcribed Image Text:A random sample of 110 automobile owners in a region shows that an automobile is driven on average 25,500 kilometers
per year with a standard deviation of 4400 kilometers. Assume the distribution of measurements to be approximately normal.
Construct a 99% prediction interval for the kilometers traveled annually by an automobile owner in the region.
Click here to view page 1 of the standard normal distribution table.
Click here to view page 2 of the standard normal distribution table.
Click here to view page 1 of the table of critical values of the t-distribution.
Click here to view page 2 of the table of critical values of the t-distribution.
The prediction interval is < x <
(Round to the nearest integer as needed.)
Expert Solution
This question has been solved!
Explore an expertly crafted, step-by-step solution for a thorough understanding of key concepts.

Step by stepSolved in 2 steps

Knowledge Booster

Similar questions
Recommended textbooks for you
- A First Course in Probability (10th Edition)ProbabilityISBN:9780134753119Author:Sheldon RossPublisher:PEARSON

A First Course in Probability (10th Edition)
Probability
ISBN:9780134753119
Author:Sheldon Ross
Publisher:PEARSON