MATLAB: An Introduction with Applications
6th Edition
ISBN: 9781119256830
Author: Amos Gilat
Publisher: John Wiley & Sons Inc
expand_more
expand_more
format_list_bulleted
Topic Video
Question

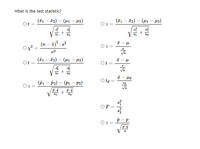
Transcribed Image Text:**What is the test statistic?**
- \( \circ \ t = \frac{(\bar{x}_1 - \bar{x}_2) - (\mu_1 - \mu_2)}{\sqrt{\frac{s_1^2}{n_1} + \frac{s_2^2}{n_2}}} \)
- \( \circ \ z = \frac{(\bar{x}_1 - \bar{x}_2) - (\mu_1 - \mu_2)}{\sqrt{\frac{\sigma_1^2}{n_1} + \frac{\sigma_2^2}{n_2}}} \)
- \( \circ \ \chi^2 = \frac{(n - 1)^2 \cdot s^2}{\sigma^2} \)
- \( \circ \ z = \frac{\bar{x} - \mu}{\sigma / \sqrt{n}} \)
- \( \circ \ t = \frac{(\bar{x}_1 - \bar{x}_2) - (\mu_1 - \mu_2)}{\sqrt{\frac{sp^2}{n_1} + \frac{sp^2}{n_2}}} \)
- \( \circ \ t = \frac{\bar{x} - \mu}{s / \sqrt{n}} \)
- \( \circ \ z = \frac{(\hat{p}_1 - \hat{p}_2) - (p_1 - p_2)}{\sqrt{\frac{\hat{p} \cdot \hat{q}}{n_1} + \frac{\hat{p} \cdot \hat{q}}{n_2}}} \)
- \( \circ \ t_d = \frac{\bar{x} - \mu_d}{s_d / \sqrt{n}} \)
- \( \circ \ F = \frac{s_1^2}{s_2^2} \)
- \( \circ \ z = \frac{\hat{p} - p}{\sqrt{\frac{p \cdot q}{n}}} \)

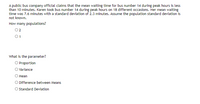
Transcribed Image Text:A public bus company official claims that the mean waiting time for bus number 14 during peak hours is less than 10 minutes. Karen took bus number 14 during peak hours on 18 different occasions. Her mean waiting time was 7.6 minutes with a standard deviation of 2.3 minutes. Assume the population standard deviation is not known.
**How many populations?**
- ○ 2
- ○ 1
**What is the parameter?**
- ○ Proportion
- ○ Variance
- ○ Mean
- ○ Difference between Means
- ○ Standard Deviation
Expert Solution
This question has been solved!
Explore an expertly crafted, step-by-step solution for a thorough understanding of key concepts.
This is a popular solution
Trending nowThis is a popular solution!
Step by stepSolved in 2 steps with 2 images

Knowledge Booster
Learn more about
Need a deep-dive on the concept behind this application? Look no further. Learn more about this topic, statistics and related others by exploring similar questions and additional content below.Similar questions
- Given a mean, standard deviation, and a raw score, find the corresponding z-score. Assume the distribution is normal. mean 70, standard deviation 4, x = 80 What is the corresponding z-score? z=arrow_forwardThe second box options are so not reject & reject the third box options are is not and is. Pls help i need in an hour Thankyou.arrow_forwardConsider a value to be significantly low if its z score less than or equal to -2 or consider a value to be significantly high if its z score is greater than or equal to 2. A data set lists weights (grams) of a type of coin. Those weights have a mean of 5.30979 g and a standard deviation of 0.06539 g. Identify the weights that are significantly low or significantly high. .BBE What weights are significantly low? Select the correct answer below and fill in the answer box(es) to complete your choice. O A. Weights that are greater than (Round to five decimal places as needed.) O B. Weights that are between and (Round to five decimal places as needed. Use ascending order.) OCWeights that are less than (Round to five decimal places as needed.)arrow_forward
- When using 1-Var Stats on a scientific or graphing calculator, the resulting statistical output includes two values for the standard deviation of the data set. These values are labeled as Sxand σx in the statistical output. Why is it necessary to give two values for the standard deviation? How would you choose which one to use as the standard deviation of a data set you are working with? Be sure to explain the difference between these two values as you answer these questionsarrow_forwardConsider the following sample data. Sample A: 5, 8, 11 Sample B: 64, 67, 70 Sample C: 1,015; 1,018; 1,021 (a) Find the mean and standard deviation for each sample. (b) What does this exercise show about the standard deviation? multiple choice The idea is to illustrate that the standard deviation is not a function of the value of the mean. The idea is to illustrate that the standard deviation is a function of the value of the mean.arrow_forwardopen file attached for questionarrow_forward
- The mean number of eggs per person eaten in the United States is 252 and the standard deviation is 68. Do college students eat more than the average? The 45 college students surveyed averaged 281 eggs per person. What can be concluded at the 0.05 level of significance? H0: = 252 Ha: _____________ 252 Test statistic: __________ p-Value =__________ Reject/Fail to reject H0?______________ Conclusion: There is____________ evidence to make the conclusion that the population mean number of eggs consumed college students per year is more than 252 eggs per student per year. p-Value Interpretation: If the mean number of eggs consumed per year for college students is equal to_________ and if another study was done with a new randomly selected group of 45 college students, then there is a ____________ percent chance that the average number of eggs consumed per year for this new sample would be greater than_____________ . Level of significance…arrow_forwardA group of adult males has foot lengths with a mean of 28.43 cm and a standard deviation of 1.13 cm. Use the range rule of thumb for identifying significant values to identify the limits separating values that are significantly 25.7 cm significantly low or significantly high? Explain. Significantly low values are cm or lower. (Type an integer or a decimal. Do not round.) Significantly high values are cm or higher. (Type an integer or a decimal. Do not round.) Select the correct choice below and fill in the answer box(es) to complete your choice. O A. The adult male foot length of 25.7 cm is significantly high because it is greater than cm (Type an integer or a decimal. Do not round.) O B. The adult male foot length of 25.7 cm is not significant because it is between (Type integers or decimals. Do not round.) cm and O C. The adult male foot length of 25.7 cm is significantly low because it is less than cm (Type an integer or a decimal. Do not round.) cm C or significantly high. Is the…arrow_forwardent will 3. The average price of a personal computer is $949. If the computer prices are approximately normally distributed with a standard deviation of $100... a. the top 20% of personal computers cost more than what amount? b. the least expensive 10% of personal computers cost less than what amount?arrow_forward
arrow_back_ios
arrow_forward_ios
Recommended textbooks for you
 MATLAB: An Introduction with ApplicationsStatisticsISBN:9781119256830Author:Amos GilatPublisher:John Wiley & Sons Inc
 Probability and Statistics for Engineering and th...StatisticsISBN:9781305251809Author:Jay L. DevorePublisher:Cengage Learning
 Statistics for The Behavioral Sciences (MindTap C...StatisticsISBN:9781305504912Author:Frederick J Gravetter, Larry B. WallnauPublisher:Cengage Learning
 Elementary Statistics: Picturing the World (7th E...StatisticsISBN:9780134683416Author:Ron Larson, Betsy FarberPublisher:PEARSON
 The Basic Practice of StatisticsStatisticsISBN:9781319042578Author:David S. Moore, William I. Notz, Michael A. FlignerPublisher:W. H. Freeman
 Introduction to the Practice of StatisticsStatisticsISBN:9781319013387Author:David S. Moore, George P. McCabe, Bruce A. CraigPublisher:W. H. Freeman

MATLAB: An Introduction with Applications
Statistics
ISBN:9781119256830
Author:Amos Gilat
Publisher:John Wiley & Sons Inc

Probability and Statistics for Engineering and th...
Statistics
ISBN:9781305251809
Author:Jay L. Devore
Publisher:Cengage Learning

Statistics for The Behavioral Sciences (MindTap C...
Statistics
ISBN:9781305504912
Author:Frederick J Gravetter, Larry B. Wallnau
Publisher:Cengage Learning

Elementary Statistics: Picturing the World (7th E...
Statistics
ISBN:9780134683416
Author:Ron Larson, Betsy Farber
Publisher:PEARSON

The Basic Practice of Statistics
Statistics
ISBN:9781319042578
Author:David S. Moore, William I. Notz, Michael A. Fligner
Publisher:W. H. Freeman

Introduction to the Practice of Statistics
Statistics
ISBN:9781319013387
Author:David S. Moore, George P. McCabe, Bruce A. Craig
Publisher:W. H. Freeman