6. A program to decrease littering was carried out in the University of Ghana starting in August 2018. The amount of litter in the streets (average kilograms of litter collected per block per day) was measured during July before the program started and then the next July, after the program had been in effect for a year. What statistical test would be most appropriate for testing whether the amount of littering reduced? Explain your answer.
Trending nowThis is a popular solution!
Step by stepSolved in 2 steps

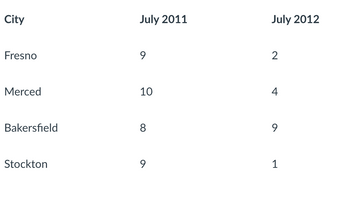
A program to decrease littering was carried out in four cities in California’s Central Valley starting in August 2011. The amount of litter in the streets was measured during July before the program started and then the next July, after the program had been in effect for a year. Using the data below, and using an alpha = .05, was there a significant decrease in the amount of litter?

A program to decrease littering was carried out in four cities in California’s Central Valley starting in August 2011. The amount of litter in the streets was measured during July before the program started and then the next July, after the program had been in effect for a year. Using the data below, and using an alpha = .05, was there a significant decrease in the amount of litter?

- In 2006, the average household debt service ratio for homeowners was 14.35. The household debt service ratio is the ratio of debt payments to disposable personal income. Debt payments consist of mortgage payments and payments on consumer debts. To determine whether this economic measure has increased a random sample of Americans was drawn. Can we infer from the data that the debt service ratio has increased since 2006? Use a 5% significance level. ONLY USE EXCEL AND PLEASE SHOW ALL STEPS AND EXCEL COMMANDS. Debt ratio 13.93 17.35 16.37 18.15 14.22 11.4 14.77 13.8 16.1 11.58 13 17.57 13.57 11.76 14.32 10.87 13.72 10.13 9.51 18.1 10.26 14.92 9.61 13.5 13.43 9.79 18.92 15.28 13.43 3.09 16.37 17.41 14.66 12.11 10.31 13.95 16.09 13.03 14.22 20.57 13.61 14.89 13.69 17.3 16.39 16.3 9.3 17.06 11.32 9.63 10.19 15.49 14.69 16.09 7.91 12.76 11.66 18.31 16.57 11.69 6.19…arrow_forwardDefine “attributable risk” and explain the interpretation of this measure of association. What are the basic uses of descriptive statistics? State and define the three measures of Central tendency.arrow_forward
 MATLAB: An Introduction with ApplicationsStatisticsISBN:9781119256830Author:Amos GilatPublisher:John Wiley & Sons Inc
 Probability and Statistics for Engineering and th...StatisticsISBN:9781305251809Author:Jay L. DevorePublisher:Cengage Learning
 Statistics for The Behavioral Sciences (MindTap C...StatisticsISBN:9781305504912Author:Frederick J Gravetter, Larry B. WallnauPublisher:Cengage Learning
 Elementary Statistics: Picturing the World (7th E...StatisticsISBN:9780134683416Author:Ron Larson, Betsy FarberPublisher:PEARSON
 The Basic Practice of StatisticsStatisticsISBN:9781319042578Author:David S. Moore, William I. Notz, Michael A. FlignerPublisher:W. H. Freeman
 Introduction to the Practice of StatisticsStatisticsISBN:9781319013387Author:David S. Moore, George P. McCabe, Bruce A. CraigPublisher:W. H. Freeman


