MATLAB: An Introduction with Applications
6th Edition
ISBN: 9781119256830
Author: Amos Gilat
Publisher: John Wiley & Sons Inc
expand_more
expand_more
format_list_bulleted
Question

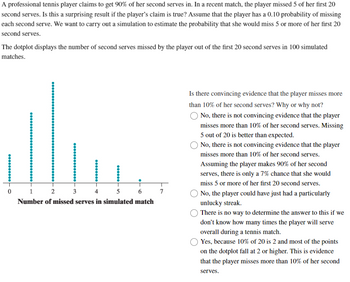
Transcribed Image Text:**Simulation of Tennis Serve Accuracy**
A professional tennis player claims to successfully deliver 90% of her second serves. Recently, she missed 5 out of her first 20 second serves in a match. To evaluate if this outcome is surprising given her claim, we can simulate the probability of missing 5 or more serves in her first 20 attempts assuming a 10% miss probability per serve.
**Dotplot Analysis:**
The dotplot illustrates the number of second serves missed out of the first 20 serves in 100 simulated matches. The x-axis represents the number of missed serves in the simulated match, ranging from 0 to 7. Each dot corresponds to the frequency of that number of missed serves occurring.
**Interpretation of Results:**
- The distribution is centered around 2 missed serves, indicating that missing around 2 serves is most common if the player’s claim is accurate.
- A small number of simulations resulted in the player missing 5 or more of her first 20 serves.
**Question for Analysis:**
Is there sufficient evidence that the player misses more than 10% of her second serves?
**Answer Options:**
- No, missing 5 out of 20 is better than expected.
- No, with only a 7% chance of missing 5 or more serves, there isn't convincing evidence against her claim.
- No, it's possible the player had an unlucky streak.
- Uncertain, without knowing the overall number of serves.
- Yes, given 10% of 20 is 2, and many results show 2 or more missed serves, suggesting more than 10% misses.
Engage with this activity by evaluating the dotplot and choosing the interpretation that aligns with your understanding of probability and statistical evidence.
Expert Solution
This question has been solved!
Explore an expertly crafted, step-by-step solution for a thorough understanding of key concepts.
This is a popular solution
Trending nowThis is a popular solution!
Step by stepSolved in 2 steps

Knowledge Booster
Similar questions
- Connor is an oncologist with 7 patients in their care. The probability that a patient will survive 5 years after being diagnosed with stage 2 pancreatic cancer is 0.34. What is the probability that 7 of the patients are still alive after 5 years?arrow_forwardA drunken pirate stands in the center of a ship's deck. Every second the pirate moves right or left only. Every second the pirate moves to the right with a probability of 0.1 The steps are independent of each other. The edge of the deck is 5 steps away from the pirate. What is the chance that the pirate will fall off the ship after exactly 5 seconds?arrow_forwardA surgical technique is performed on seven patients. The technique has a 70% chance of success. Find the probability that the surgery is successful for at least five patients.arrow_forward
- In a recent poll of voters, 20% were displeased with both candidates. If 3 people were picked at random. find the probability that at least one liked one of the candidates.arrow_forwardIf the probability of rain tomorrow is 65%, what is the probability that it will not rain tomorrow?arrow_forwardIn world cup soccer the probability that a soccer team makes a penalty kick goal is about 72.5%. If a team attempts five consecutive penalty kicks, what is the probability that they will make at least one of the five attemptsarrow_forward
- Gg.94. According to Baseball Insider Magazine 25% of major league pitchers are left-handed. A recent report shows that 60% of left-handed pitcher undergo rotator cuff surgery, while 30% of right-handed pitchers undergo rotator cuff surgery. If a major league pitcher underwent rotator cuff surgery yesterday afternoon, what is the probability that this pitcher was right-handed and underwent rotator cuff surgery?arrow_forwardThe weather report says that there is a 50% chance to rain tomorrow. What type of event is this?arrow_forward
arrow_back_ios
arrow_forward_ios
Recommended textbooks for you
 MATLAB: An Introduction with ApplicationsStatisticsISBN:9781119256830Author:Amos GilatPublisher:John Wiley & Sons Inc
 Probability and Statistics for Engineering and th...StatisticsISBN:9781305251809Author:Jay L. DevorePublisher:Cengage Learning
 Statistics for The Behavioral Sciences (MindTap C...StatisticsISBN:9781305504912Author:Frederick J Gravetter, Larry B. WallnauPublisher:Cengage Learning
 Elementary Statistics: Picturing the World (7th E...StatisticsISBN:9780134683416Author:Ron Larson, Betsy FarberPublisher:PEARSON
 The Basic Practice of StatisticsStatisticsISBN:9781319042578Author:David S. Moore, William I. Notz, Michael A. FlignerPublisher:W. H. Freeman
 Introduction to the Practice of StatisticsStatisticsISBN:9781319013387Author:David S. Moore, George P. McCabe, Bruce A. CraigPublisher:W. H. Freeman

MATLAB: An Introduction with Applications
Statistics
ISBN:9781119256830
Author:Amos Gilat
Publisher:John Wiley & Sons Inc

Probability and Statistics for Engineering and th...
Statistics
ISBN:9781305251809
Author:Jay L. Devore
Publisher:Cengage Learning

Statistics for The Behavioral Sciences (MindTap C...
Statistics
ISBN:9781305504912
Author:Frederick J Gravetter, Larry B. Wallnau
Publisher:Cengage Learning

Elementary Statistics: Picturing the World (7th E...
Statistics
ISBN:9780134683416
Author:Ron Larson, Betsy Farber
Publisher:PEARSON

The Basic Practice of Statistics
Statistics
ISBN:9781319042578
Author:David S. Moore, William I. Notz, Michael A. Fligner
Publisher:W. H. Freeman

Introduction to the Practice of Statistics
Statistics
ISBN:9781319013387
Author:David S. Moore, George P. McCabe, Bruce A. Craig
Publisher:W. H. Freeman