MATLAB: An Introduction with Applications
6th Edition
ISBN: 9781119256830
Author: Amos Gilat
Publisher: John Wiley & Sons Inc
expand_more
expand_more
format_list_bulleted
Question
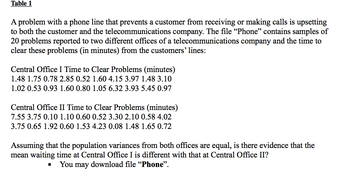
Referring to Table 1, judging from the way the data were collected, which test would likely be most appropriate to employ?
Question 24 options:
|
|
|
||
|
|
|
||
|
|
|
||
|
|
|

Transcribed Image Text:Table 1
A problem with a phone line that prevents a customer from receiving or making calls is upsetting
to both the customer and the telecommunications company. The file "Phone" contains samples of
20 problems reported to two different offices of a telecommunications company and the time to
clear these problems (in minutes) from the customers' lines:
Central Office I Time to Clear Problems (minutes)
1.48 1.75 0.78 2.85 0.52 1.60 4.15 3.97 1.48 3.10
1.02 0.53 0.93 1.60 0.80 1.05 6.32 3.93 5.45 0.97
Central Office II Time to Clear Problems (minutes)
7.55 3.75 0.10 1.10 0.60 0.52 3.30 2.10 0.58 4.02
3.75 0.65 1.92 0.60 1.53 4.23 0.08 1.48 1.65 0.72
Assuming that the population variances from both offices are equal, is there evidence that the
mean waiting time at Central Office I is different with that at Central Office II?
You may download file "Phone".
Expert Solution
This question has been solved!
Explore an expertly crafted, step-by-step solution for a thorough understanding of key concepts.
Step by stepSolved in 3 steps

Knowledge Booster
Similar questions
- Listed below are student evaluation of female professions and male professors. Use a 0.05 significance level to test the claim that female professors and male professors have the same mean evaluations ratings. P-value: 0.758arrow_forwardChi-sauare distribution table Question Viewer Degrees of Freedom 1 234569 7 8 10 0.995 0.010 0.072 0.207 0.412 0.676 0.989 1.344 1.735 2.156 0.99 0.020 0.115 0.297 0.554 0.872 1.239 1.646 2.088 2.558 Area to the Right of the critical value 0.975 0.001 0.051 0.216 0.484 0.831 1.237 1.690 2.180 2.700 3.247 0.95 0.004 0.103 0.352 0.711 1.145 1.635 2.167 2.733 3.325 3.940 I 0.90 0.016 0.211 0.584 1.064 1.610 2.204 2.833 3.490 4.168 4.865 0.10 2.706 4.605 6.251 7.779 9.236 10.645 12.017 13.362 14.684 15.987arrow_forwardA poll was conducted to investigate opinions about global warming. The respondents who answered yes when asked if Question Viewer idence that the earth is getting warmer were then asked to select a cause of global warming. The results are given in the accompanying data table. Use a 0.05 significance level to test the claim that the sex of the respondent is independent of the choice for the cause of global warming. Do men and women appear to agree, or is there a substantial difference? Human activity Natural patterns Male 340 164 Female 319 161 Click here to view the chi-square distribution table. Identify the null and alternative hypotheses. The sex of the respondent The sex of the respondent Ho: H₁: Compute the test statistic. Don't know 27 29 and the choice for the cause of global warming are independent. and the choice for the cause of global warming are dependent. (Round to three decimal places as needed.)arrow_forward
- 7.Which of the values below is closest to the IQR for a normally distributed population with a variance of 36? chosse one: 5,6,7,8,9arrow_forwardwhat is the answer?arrow_forwardIf the data normalization process is carried out on a dataset, which of the following statements is correct: a) The correlation value between variables will not change b) The covariance value between variables will not change c) The average value of each variable will not change d) The standard deviation value for each variable will not changearrow_forward
- give an example of a study for which the independent sample t-test is appropiatearrow_forwardTo test whether there is a difference in the quality of some ballpoint pens produced by Scribulus, Writine, and Fantapen, random samples from each brand were purchased and the following data were collected: Scribulus Writinc Fantapen number purchased failed to write 41 29 16 300 250 200 Use a 5% level of significance to test whether there is any difference in quality measured by the proportion of pens that failed to write.arrow_forward
arrow_back_ios
arrow_forward_ios
Recommended textbooks for you
 MATLAB: An Introduction with ApplicationsStatisticsISBN:9781119256830Author:Amos GilatPublisher:John Wiley & Sons Inc
 Probability and Statistics for Engineering and th...StatisticsISBN:9781305251809Author:Jay L. DevorePublisher:Cengage Learning
 Statistics for The Behavioral Sciences (MindTap C...StatisticsISBN:9781305504912Author:Frederick J Gravetter, Larry B. WallnauPublisher:Cengage Learning
 Elementary Statistics: Picturing the World (7th E...StatisticsISBN:9780134683416Author:Ron Larson, Betsy FarberPublisher:PEARSON
 The Basic Practice of StatisticsStatisticsISBN:9781319042578Author:David S. Moore, William I. Notz, Michael A. FlignerPublisher:W. H. Freeman
 Introduction to the Practice of StatisticsStatisticsISBN:9781319013387Author:David S. Moore, George P. McCabe, Bruce A. CraigPublisher:W. H. Freeman

MATLAB: An Introduction with Applications
Statistics
ISBN:9781119256830
Author:Amos Gilat
Publisher:John Wiley & Sons Inc

Probability and Statistics for Engineering and th...
Statistics
ISBN:9781305251809
Author:Jay L. Devore
Publisher:Cengage Learning

Statistics for The Behavioral Sciences (MindTap C...
Statistics
ISBN:9781305504912
Author:Frederick J Gravetter, Larry B. Wallnau
Publisher:Cengage Learning

Elementary Statistics: Picturing the World (7th E...
Statistics
ISBN:9780134683416
Author:Ron Larson, Betsy Farber
Publisher:PEARSON

The Basic Practice of Statistics
Statistics
ISBN:9781319042578
Author:David S. Moore, William I. Notz, Michael A. Fligner
Publisher:W. H. Freeman

Introduction to the Practice of Statistics
Statistics
ISBN:9781319013387
Author:David S. Moore, George P. McCabe, Bruce A. Craig
Publisher:W. H. Freeman