
MATLAB: An Introduction with Applications
6th Edition
ISBN: 9781119256830
Author: Amos Gilat
Publisher: John Wiley & Sons Inc
expand_more
expand_more
format_list_bulleted
Related questions
Question
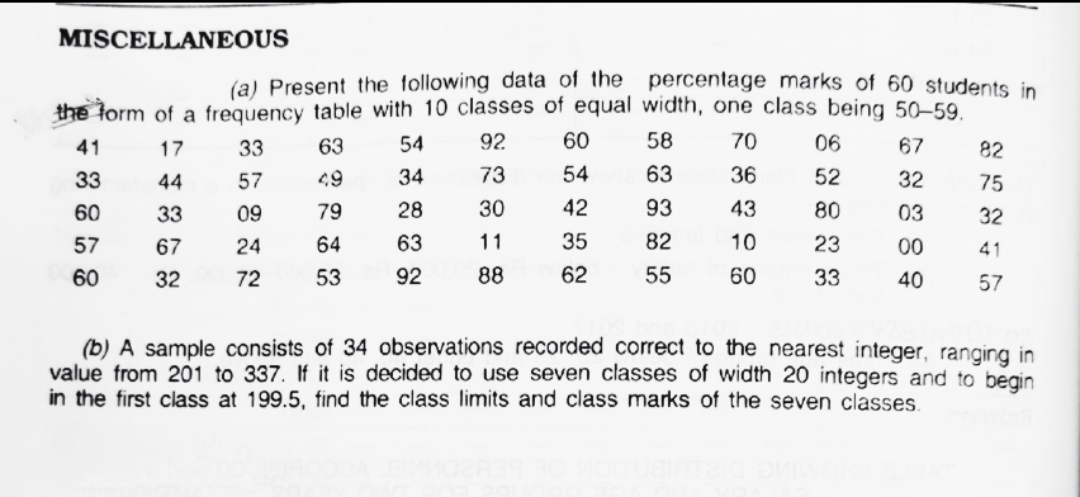

Transcribed Image Text:MISCELLANEOUS
(a) Present the following data of the percentage marks of 60 students in
the form of a frequency table with 10 classes of equal width, one class being 50-59.
41
17
33
63
54
92
60
58
70
06
67
82
33
44
57
49
34
73
54
63
36
52
32
75
60
33
09
79
28
30
42
93
43
80
03
32
57
67
24
64
63
11
35
82
10
23
00
41
60
32
72
53
92
88
62
55
60
33
40
57
(b) A sample consists of 34 observations recorded correct to the nearest integer, ranging in
value from 201 to 337. If it is decided
in the first class at 199.5, find the class limits and class marks of the seven classes.
use seven classes of width 20 integers and to begin
Expert Solution
This question has been solved!
Explore an expertly crafted, step-by-step solution for a thorough understanding of key concepts.

This is a popular solution

Trending nowThis is a popular solution!

Step by stepSolved in 2 steps with 1 images

Knowledge Booster

Similar questions
- The following data represents the age of 30 lottery winners. 23 28 29 31 33 41 44 49 49 49 49 55 57 57 60 63 63 64 66 66 67 68 69 69 70 71 73 75 76 87 Complete the frequency distribution for the data. Age Frequency 20-29 30-39 40-49 50-59 60-69 70-79 A 80-89arrow_forwardThe following are the ages of 30 employees at a local computer company: 29 35 21 28 25 36 44 27 24 24 19 21 33 32 49 25 26 20 32 29 23 37 26 31 29 28 25 25 30 24 0. Find the minimum and maximum of the data. 1. Create a stemplot of the data. 2. Organize the stems of the stemplot. 3. Create a new stemplot by splitting the stems. 4. Make a frequency table of the data, with a first interval of “19-22": 5. Create a histogram of the data from the frequency table. 6. Check your work by replicating the histogram on your calculator.arrow_forwardThe following are the grades received on an paper by 25 students. 97 97 98 40 45 77 65 65 65 68 81 93 68 71 87 85 88 76 79 78 87 81 81 83 89 a) Fill in the frequency table below using the data given. Use 10-point bins. Note: You may have rows left over. Grade Frequency Relative Frequency Cumulative Frequency Total: b) Draw a histogram based on the frequency table in part a . Don’t forget to label properly the axes, and put a title.arrow_forward
arrow_back_ios
arrow_forward_ios
Recommended textbooks for you
- MATLAB: An Introduction with ApplicationsStatisticsISBN:9781119256830Author:Amos GilatPublisher:John Wiley & Sons Inc
 Probability and Statistics for Engineering and th...StatisticsISBN:9781305251809Author:Jay L. DevorePublisher:Cengage Learning
 Statistics for The Behavioral Sciences (MindTap C...StatisticsISBN:9781305504912Author:Frederick J Gravetter, Larry B. WallnauPublisher:Cengage Learning
  Elementary Statistics: Picturing the World (7th E...StatisticsISBN:9780134683416Author:Ron Larson, Betsy FarberPublisher:PEARSON
 The Basic Practice of StatisticsStatisticsISBN:9781319042578Author:David S. Moore, William I. Notz, Michael A. FlignerPublisher:W. H. Freeman
 Introduction to the Practice of StatisticsStatisticsISBN:9781319013387Author:David S. Moore, George P. McCabe, Bruce A. CraigPublisher:W. H. Freeman
MATLAB: An Introduction with Applications
Statistics
ISBN:9781119256830
Author:Amos Gilat
Publisher:John Wiley & Sons Inc
Probability and Statistics for Engineering and th...
Statistics
ISBN:9781305251809
Author:Jay L. Devore
Publisher:Cengage Learning
Statistics for The Behavioral Sciences (MindTap C...
Statistics
ISBN:9781305504912
Author:Frederick J Gravetter, Larry B. Wallnau
Publisher:Cengage Learning
Elementary Statistics: Picturing the World (7th E...
Statistics
ISBN:9780134683416
Author:Ron Larson, Betsy Farber
Publisher:PEARSON
The Basic Practice of Statistics
Statistics
ISBN:9781319042578
Author:David S. Moore, William I. Notz, Michael A. Fligner
Publisher:W. H. Freeman
Introduction to the Practice of Statistics
Statistics
ISBN:9781319013387
Author:David S. Moore, George P. McCabe, Bruce A. Craig
Publisher:W. H. Freeman