MATLAB: An Introduction with Applications
6th Edition
ISBN: 9781119256830
Author: Amos Gilat
Publisher: John Wiley & Sons Inc
expand_more
expand_more
format_list_bulleted
Question
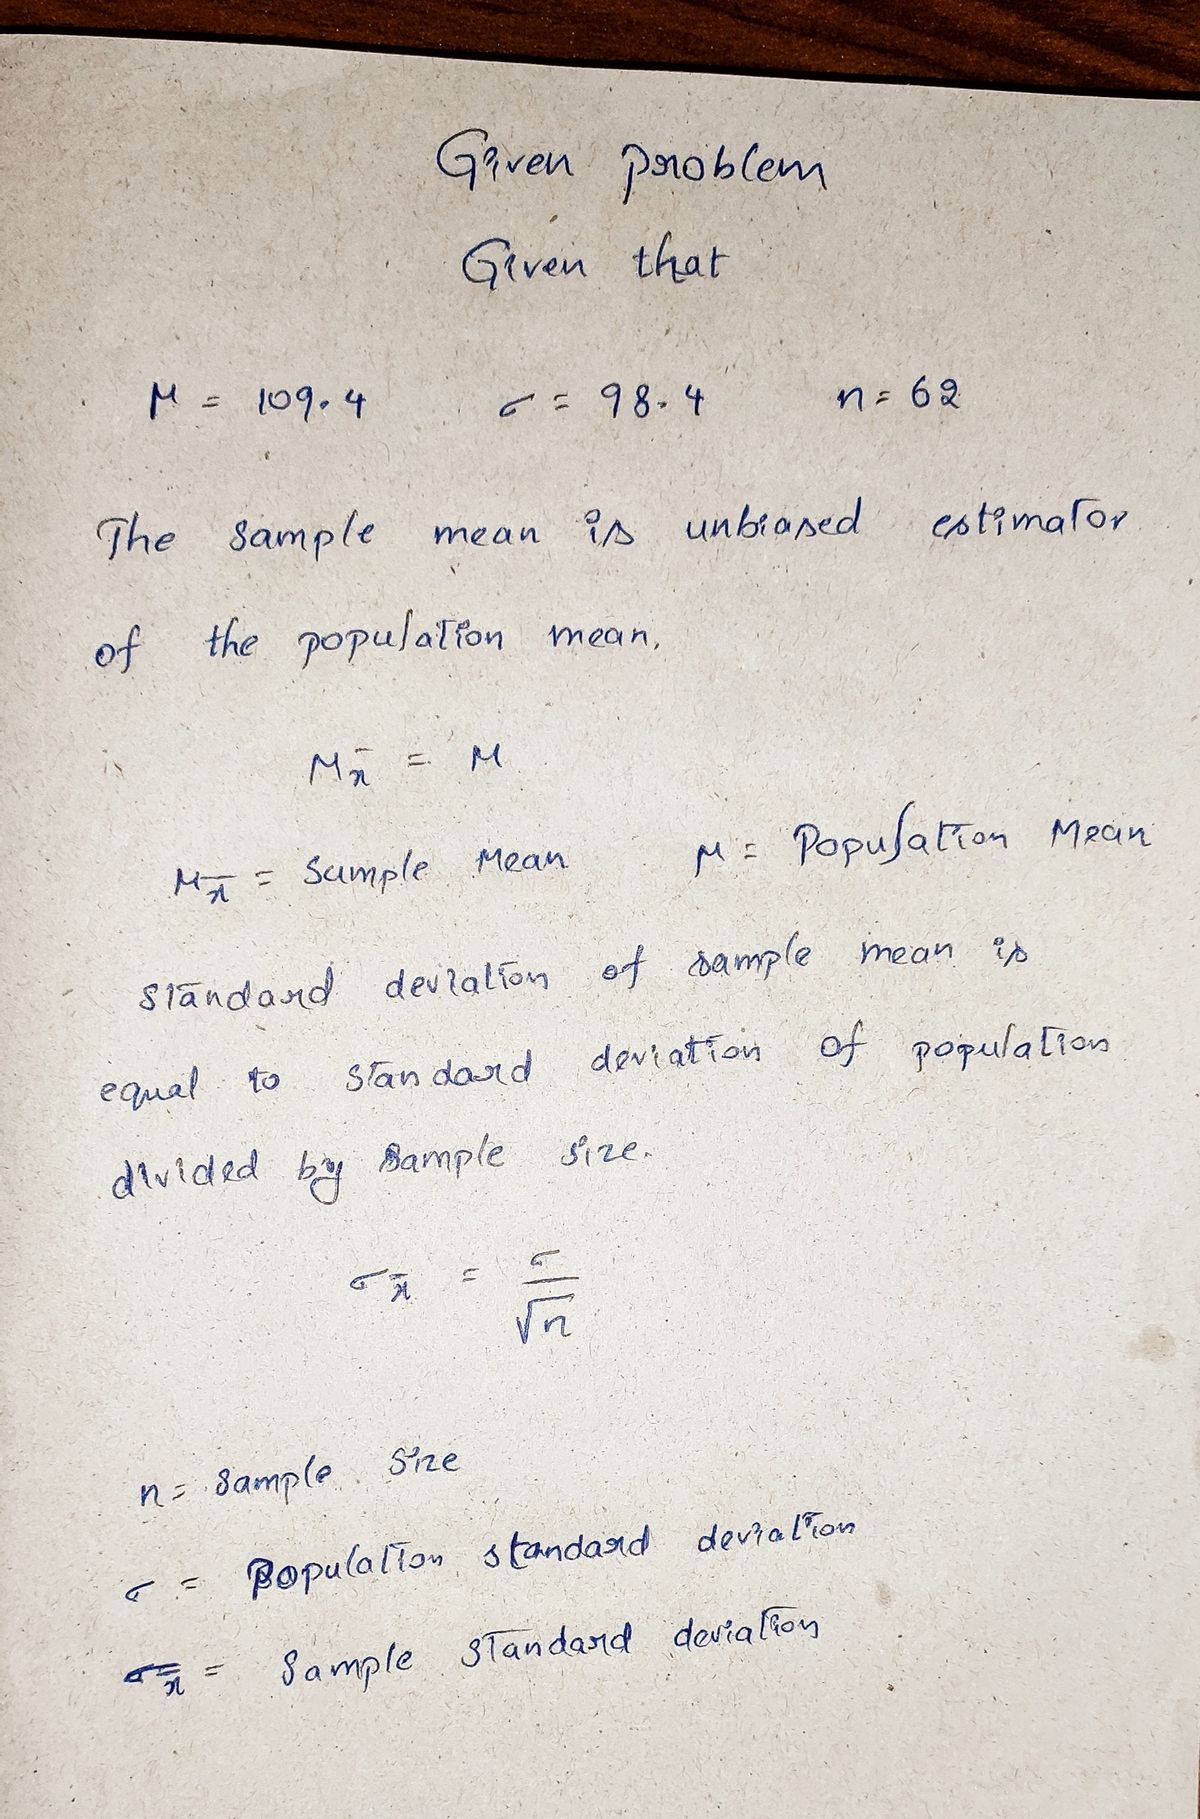
A population has parameters μ=109.4μ=109.4 and σ=98.4σ=98.4. You intend to draw a random sample of size n=62n=62.
What is the mean of the distribution of sample means?
μ¯x=μx¯=
What is the standard deviation of the distribution of sample means?
(Report answer accurate to 2 decimal places.)
σ¯x=σx¯=
Expert Solution
arrow_forward
Step 1
Given problem
Given that

Step by stepSolved in 2 steps with 2 images

Knowledge Booster
Similar questions
- Ages of Gamblers The mean age of a sample of 25 people who were playing the slot machines is 49.9 years, and the standard deviation is 6.8 years. The mean age of a sample of 33 people who were playing roulette is 55.5 with a standard deviation of 3.2 years. Can it be concluded at =α0.10 that the mean age of those playing the slot machines is less than those playing roulette? Use μ1 for the mean age of those playing slot machines. Assume the variables are normally distributed and the variances are unequal. State the hypotheses and identify the claim with the correct hypothesis. H0: Claim or not a claim H1: Claim or not a claim This Hypothesis test is a one-tailed or two-tailed test. Find the critical value(s). Round the answer to at least two decimal places. If there is more than one critical value, separate them with commas. Critical Value(s): Compute the test value. Always round z score to at leat 2 decimal places. z= Make the decision reject or accept the null hypothesis.…arrow_forwardA population of values has a normal distribution with μ=165.6μ=165.6 and σ=91.4σ=91.4. You intend to draw a random sample of size n=72n=72.What is the mean of the distribution of sample means?μ¯x=μx¯= What is the standard deviation of the distribution of sample means?σ¯x=σx¯= Round to 4 decimal places.arrow_forwardAssume the random variable X is normally distributed, with mean μ=50 and standard deviation σ=7 Find the 81st percentile.arrow_forward
- A population of values has a normal distribution with μ=200.6μ=200.6 and σ=20.8σ=20.8. You intend to draw a random sample of size n=236n=236.Find P17, which is the mean separating the bottom 17% means from the top 83% means.The mean = (Use 1 decimal place)arrow_forwardA population has a mean = 151 and a standard deviation a=30. Find the mean and standard deviation of the sampling distribution of sample means with sample size n = 42. The mean is μ =, and the standard deviation is o= (Round to three decimal Places as needed.)arrow_forwardAssume the random variable X is normally distributed with mean μ=50 and standard deviation σ=7. Find the 87th percentile.arrow_forward
- The mean is 146 and the standard deviation is 35. A score of 41 is how many z-scores below the mean?arrow_forwardSuppose the scores on a standardized test are normally distributed with mean μ=340μ=340 and the standard deviation σ=32σ=32. Use the normal distribution to find: The lowest test score in the top 15% bracket.Ans: The highest score in the bottom 20% bracket.Ans:arrow_forwardA sample of 14 small bags of the same brand of candies was selected. Assume that the population distribution of bag weights is normal. The weight of each bag was then recorded. The mean weight was 2 ounces with a standard deviation of 0.12 ounces. The population standard deviation is known to be 0.1 ounce. x = σ = sx = n = n − 1 =arrow_forward
- A normal population has mean =μ9 and standard deviation =σ5 . Find the proportion of the population that is greater than 4 . Round the answers to at least four decimal places. The proportion of the population that is greater than 4 is .arrow_forwardSuppose a variable is Normally distributed with μ=345 and sigma σ=30. What proportion of the data has values between 330 and 345? Use four decimal places in your answer.arrow_forwardA normal population has a mean μ = 31 and standard deviation = 8. What proportion of the population is less than 29?arrow_forward
arrow_back_ios
arrow_forward_ios
Recommended textbooks for you
 MATLAB: An Introduction with ApplicationsStatisticsISBN:9781119256830Author:Amos GilatPublisher:John Wiley & Sons Inc
 Probability and Statistics for Engineering and th...StatisticsISBN:9781305251809Author:Jay L. DevorePublisher:Cengage Learning
 Statistics for The Behavioral Sciences (MindTap C...StatisticsISBN:9781305504912Author:Frederick J Gravetter, Larry B. WallnauPublisher:Cengage Learning
 Elementary Statistics: Picturing the World (7th E...StatisticsISBN:9780134683416Author:Ron Larson, Betsy FarberPublisher:PEARSON
 The Basic Practice of StatisticsStatisticsISBN:9781319042578Author:David S. Moore, William I. Notz, Michael A. FlignerPublisher:W. H. Freeman
 Introduction to the Practice of StatisticsStatisticsISBN:9781319013387Author:David S. Moore, George P. McCabe, Bruce A. CraigPublisher:W. H. Freeman

MATLAB: An Introduction with Applications
Statistics
ISBN:9781119256830
Author:Amos Gilat
Publisher:John Wiley & Sons Inc

Probability and Statistics for Engineering and th...
Statistics
ISBN:9781305251809
Author:Jay L. Devore
Publisher:Cengage Learning

Statistics for The Behavioral Sciences (MindTap C...
Statistics
ISBN:9781305504912
Author:Frederick J Gravetter, Larry B. Wallnau
Publisher:Cengage Learning

Elementary Statistics: Picturing the World (7th E...
Statistics
ISBN:9780134683416
Author:Ron Larson, Betsy Farber
Publisher:PEARSON

The Basic Practice of Statistics
Statistics
ISBN:9781319042578
Author:David S. Moore, William I. Notz, Michael A. Fligner
Publisher:W. H. Freeman

Introduction to the Practice of Statistics
Statistics
ISBN:9781319013387
Author:David S. Moore, George P. McCabe, Bruce A. Craig
Publisher:W. H. Freeman