
MATLAB: An Introduction with Applications
6th Edition
ISBN: 9781119256830
Author: Amos Gilat
Publisher: John Wiley & Sons Inc
expand_more
expand_more
format_list_bulleted
Related questions
Concept explainers
Topic Video
Question
Just looking for help w/ part B
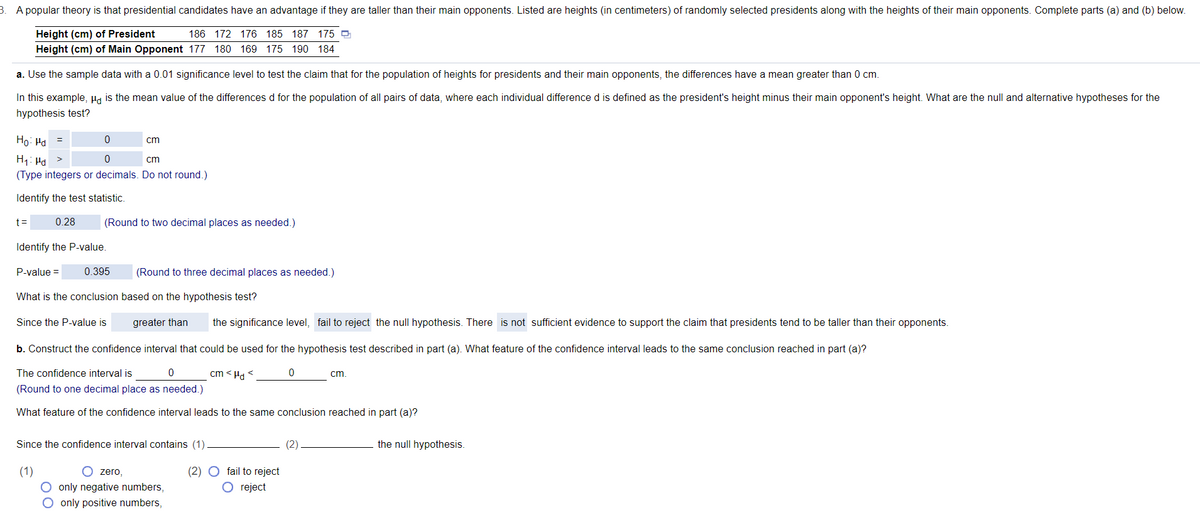

Transcribed Image Text:3. A popular theory is that presidential candidates have an advantage if they are taller than their main opponents. Listed are heights (in centimeters) of randomly selected presidents along with the heights of their main opponents. Complete parts (a) and (b) below.
Height (cm) of President
186 172 176 185 187 175 O
Height (cm) of Main Opponent 177 180 169 175 190 184
a. Use the sample data with a 0.01 significance level to test the claim that for the population of heights for presidents and their main opponents, the differences have a mean greater than 0 cm.
In this example, Ha is the mean value of the differences d for the population of all pairs of data, where each individual difference d is defined as the president's height minus their main opponent's height. What are the null and alternative hypotheses for the
hypothesis test?
Ho: Ha
cm
H1: Ha >
(Type integers or decimals. Do not round.)
cm
Identify the test statistic.
t=
0.28
(Round to two decimal places as needed.)
Identify the P-value.
P-value =
0.395
(Round to three decimal places as needed.)
What is the conclusion based on the hypothesis test?
Since the P-value is
greater than
the significance level, fail to reject the null hypothesis. There is not sufficient evidence to support the claim that presidents tend to be taller than their opponents.
b. Construct the confidence interval that could be used for the hypothesis test described in part (a). What feature of the confidence interval leads to the same conclusion reached in part (a)?
The confidence interval is
cm < Ha <
cm.
(Round to one decimal place as needed.)
What feature of the confidence interval leads to the same conclusion reached in part (a)?
Since the confidence interval contains (1)
(2)
the null hypothesis.
(1)
O zero,
(2) O fail to reject
only negative numbers,
O reject
O only positive numbers,
Expert Solution
This question has been solved!
Explore an expertly crafted, step-by-step solution for a thorough understanding of key concepts.

Step by stepSolved in 2 steps

Knowledge Booster


Learn more about
Need a deep-dive on the concept behind this application? Look no further. Learn more about this topic, statistics and related others by exploring similar questions and additional content below.Similar questions
- Fast answer give you good reviewsarrow_forwardCheok vour solutien Salntha sustam of linequetiono vy sur 12. x = 2 y + 7 1 10. y = x - 4 11. y = 2x + 5 3x - 2y = 3 y = 4x – 10 y = 3x – 1 15. 8x = 0 13. 4.x - 2y = 14 14. 2x = y - 10 12x + 3 = y x + 7 = y y =x - 1 2arrow_forwardVolur X es lomework Maps Wishful Dreamer I... Proct X Value of the car @2 W heducation.com/ext/map/index.html?_con=con&external_browser=0&launchUrl=https%253A%252F%252Flms.mheducation.com%252Fmghmic #3 Missi X с E Inc A X A car that originally cost $3,993 in 1955 is valued at $71,500 if in excellent condition. This is 23 times as much as a car in very nice condition-if you can find an owner willing to part with one for any price. What would be the value of the car in very nice condition? (Do not round intermediate calculations.) 4 R Servi X % 5 U * 00 8 + - Sear X ( 9 Gsage x ) O O H Farrow_forward
- ent/d/1aclVc5owmTUnYTxfQ40XLtNTfC97Tz96UgSvlS8pwk/ ADEMY_MATH 7_UNIT 6 WEEK 7 G Extensions Help Accessibility ext W Arial 2 Question 3 12 + BIU 1.12r+t-4r + 6t 2. (12r + 2) - (4r + 10f) 3.12(r+t) -6(r+t) − 4(r+f) − 2(r+f) 4 Match each expression in column A with an equivalent expression from column B. Show or explain your reasoning. Column A Column B • 8(r-t) 8(r+t) • Br+7t For each situation, write an expression for the new balance using as few terms as possible. Yarrow_forwardM Inbox - thatisdumb202 x M (no subject) - jonah.her x * gZqWqPtAcsQpUWNz- x should i side wvith the E DeltaMath b Math Homework Help, x G how do i take a screens + Process Photos: Week DeltaMath A deltamath.com/student/solve/12668563/xGameLevel3 Delta Math Student Help Video Tools - < Вack Give up Show Example Record: 0/3 Score: o Penalty: None Complete: 28% Jonah Hendon The X Game (Level 3) Feb 05, 10:14:08 AM Watch help video Write two numbers that multiply to the value on top and add to the value on bottom. -96 .4 Submit Answer Activate Windows Go to Settings to activate Windows. Privacy Policy Terms of Service Copyright © 2021 DeltaMath.com. All Rights Reserved. 10:27 AM P Type here to search 2/5/2021 22 行arrow_forward
arrow_back_ios
arrow_forward_ios
Recommended textbooks for you
- MATLAB: An Introduction with ApplicationsStatisticsISBN:9781119256830Author:Amos GilatPublisher:John Wiley & Sons Inc
 Probability and Statistics for Engineering and th...StatisticsISBN:9781305251809Author:Jay L. DevorePublisher:Cengage Learning
 Statistics for The Behavioral Sciences (MindTap C...StatisticsISBN:9781305504912Author:Frederick J Gravetter, Larry B. WallnauPublisher:Cengage Learning
  Elementary Statistics: Picturing the World (7th E...StatisticsISBN:9780134683416Author:Ron Larson, Betsy FarberPublisher:PEARSON
 The Basic Practice of StatisticsStatisticsISBN:9781319042578Author:David S. Moore, William I. Notz, Michael A. FlignerPublisher:W. H. Freeman
 Introduction to the Practice of StatisticsStatisticsISBN:9781319013387Author:David S. Moore, George P. McCabe, Bruce A. CraigPublisher:W. H. Freeman
MATLAB: An Introduction with Applications
Statistics
ISBN:9781119256830
Author:Amos Gilat
Publisher:John Wiley & Sons Inc
Probability and Statistics for Engineering and th...
Statistics
ISBN:9781305251809
Author:Jay L. Devore
Publisher:Cengage Learning
Statistics for The Behavioral Sciences (MindTap C...
Statistics
ISBN:9781305504912
Author:Frederick J Gravetter, Larry B. Wallnau
Publisher:Cengage Learning
Elementary Statistics: Picturing the World (7th E...
Statistics
ISBN:9780134683416
Author:Ron Larson, Betsy Farber
Publisher:PEARSON
The Basic Practice of Statistics
Statistics
ISBN:9781319042578
Author:David S. Moore, William I. Notz, Michael A. Fligner
Publisher:W. H. Freeman
Introduction to the Practice of Statistics
Statistics
ISBN:9781319013387
Author:David S. Moore, George P. McCabe, Bruce A. Craig
Publisher:W. H. Freeman