MATLAB: An Introduction with Applications
6th Edition
ISBN: 9781119256830
Author: Amos Gilat
Publisher: John Wiley & Sons Inc
expand_more
expand_more
format_list_bulleted
Question
thumb_up100%
A poll was conducted to investigate opinions about global warming. The respondents who answered yes when asked if there is solid evidence that the earth is getting warmer were then asked to select a cause of global warming. The results are given in the accompanying data table. Use a 0.01
significance level to test the claim that the sex of the respondent is independent of the choice for the cause of global warming. Do men and women appear to agree, or is there a substantial difference?
significance level to test the claim that the sex of the respondent is independent of the choice for the cause of global warming. Do men and women appear to agree, or is there a substantial difference?
|
|
|
|
|
|
|
|
Human activity
|
Natural patterns
|
Don't know
|
|
|---|---|---|---|---|
|
Male
|
305
|
151
|
41
|
|
|
Female
|
310
|
170
|
43
|
|
A. Identify the null and alternative hypotheses.
H0:(The sex of the respondent/Respondents who answered yes/The choice for human activity) and (the respondents who answered no/the choice for the cause of global warming/the choice for natural patterns) are (dependent/independent)
H1:(The sex of the respondent/Respondents who answered yes/The choice for human activity) and (the respondents who answered no/the choice for the cause of global warming/the choice for natural patterns) are (dependent/independent)
a2. Compute the test statistic. _____
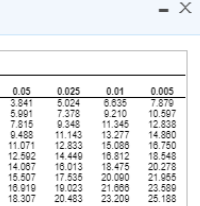
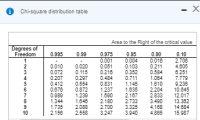
B. Find the critical value(s).
C. What is the conclusion based on the hypothesis test?
(Reject/Fail to reject) H0. There (is not/is) sufficient evidence to warrant rejection of the claim that the sex of the respondent is independent of the choice for the cause of global warming. Men and women (appear/do not appear) to agree.


Expert Solution
This question has been solved!
Explore an expertly crafted, step-by-step solution for a thorough understanding of key concepts.
This is a popular solution
Trending nowThis is a popular solution!
Step by stepSolved in 4 steps with 2 images

Knowledge Booster
Learn more about
Need a deep-dive on the concept behind this application? Look no further. Learn more about this topic, statistics and related others by exploring similar questions and additional content below.Similar questions
- Listed below are amounts of bills for dinner and the amounts of the tips that were left. Construct a scatterplot, find the value of the linear correlation coefficient r, and find the P-value of r. Determine whether there is sufficient evidence to support a claim of linear correlation between the two variables. Use a significance level of a = 0.05. If everyone were to tip with the same percentage, what should be the value of r? Bill (dollars) Tip (dollars) Tip Amount ($) Construct a scatterplot. Choose the correct graph below. O A. 25- 30 C ● ·· Bill Amount (S) 32.25 49.72 87.12 101.52 66.52 104.21 4.25 7.70 7.90 11.83 7.08 11.35 120 Q M O B. Tip Amount ($) 25- ++++ 30 .. Bill Amount (S) 120 Q Q M C O C. Tip Amount ($) 25- 0+ 30 ● ·· Bill Amount ($) 120 Q Q O D. ip Amount ($) 25- to 0- 30 · Bill Amount (S) 120 Q Q Uarrow_forwardplease answer blank questions only and or ones with a red x next to them.arrow_forwardBased on the data below, answer the following question: Draw a scatter diagram that highlights the relationship between Local Tuition and Students per Faculty. The correlation coefficient indicates that the relationship between Local Tuition and Students per Faculty is _______. Select one: a. positively correlated b. not related c. negatively correlated Business School Full-Time Enrollment Students per Faculty Local Tuition ($) Foreign Tuitiion ($) English Test Work Experience Starting Salary ($) 1 Melbourne Business School 200 5 24,420 29,600 No Yes 71,400 2 University of New South Wales (Sydney) 228 4 19,993 32,582 No Yes 65,200 3 Indian Institute of Management (Ahmedabad) 392 5 4,300 4,300 No No 7,100 4 Chinese University of Hong Kong 90 5 11,140 11,140 No No 31,000 5 International University of Japan (Niigata) 126 4 33,060 33,060 Yes No 87,000 6 Asian Institute of Management (Manila) 389 5 7,562 9,000 No Yes 22,800 7 Indian Institute of Management…arrow_forward
- find : c ) Does data provide evid. of an association between age and opinion of brand? Justify your answer.arrow_forwardUse the table to answer the questions. Compute the prevalence of true diabetes in this population. Compute the sensitivity of the test. Explain in words what your sensitivity answer means. (Do not just write the definition; include your result!) Compute the specificity of the test. Explain in words what your specificity answer means. (Do not just write the definition; include your result!) Compute the positive predictive value of the test. Explain in words what your positive predictive value answer means. (Do not just write the definition; include your result!)arrow_forwardIf one wishes to assess the relation between a farming county's average annual temperature and the crop yield, it may be important to take into account the overlapping variability that crop yield and temperature share with rainfall. To do so, one would compute a: a. partial correlation. b. split-half reliability. c. concurrent validity. d. coefficient alpha.arrow_forward
- Consider the following scenario and answer the questions below: The ornithologist decided to investigate the effect of temperature on the migration of North American birds. Develop a hypothesis in the appropriate format. Identify the independent variable. Identify the dependent variable. Plan an investigation (what would she do to collect data?). Did she engage in basic science or applied science? Explain. Did she engage in inductive or deductive reasoning? Explainarrow_forwardListed below are amounts of bills for dinner and the amounts of the tips that were left. Construct a scatterplot, find the value of the linear correlation coefficient r, and find the P-value of r. Determine whether there is sufficient evidence to support a claim of linear correlation between the two variables. Use a significance level of a = 0.01. If everyone were to tip with the same percentage, what should be the value of r? Bill (dollars) Tip (dollars) 31.80 52.94 85.82 102.16 60.17 111.77 D 5.46 6.07 15.82 15.40 11.15 20.32 Construct a scatterplot. Choose the correct graph below. O A. O B. Oc. D. Q 25- 25- 25 0- 30 0- 30 Bill Amount ($) 0+ 30 Bill Amount (S) 0- 30 Bill Amount (S) 120 120 120 Bill Amount (S) 120 The linear correlation coefficient is r= 0.954 (Round to three decimal places as needed.) Determine the null and alternative hypotheses. Ho: p H,: P (Type integers or decimals. Do not round.) Tip Amount ($) ip Amount ($) Tip Amount ($) Tip Amount ($)arrow_forwardAn insurance investigator has observed that people with some astrological signs tend to be safer drivers than people with other signs. Using insurance records, the investigator classified 150 people according to their astrological signs and whether or not they were involved in a car accident during the previous 12 months. Do the following data indicate a significant relationship between sign and accidents? Test with a = .05. Libra Leo Gemini Accident 7 4 19 No Accident 73 46 1arrow_forward
- There is a strong correlation between the number of students graduating from SVS and the population of squirrels in York Region. The most likely type of causal relationship is:A.cause and effect B.accidental C.presumed D.reverse cause and effectarrow_forwardWhich of the following variables is not a qualitative or categorical variable? Species: Warbler, Wren, Owl, etc. Moth Type: 1 = Peppered, 2 = Melanic Moth Type: 1 = Peppered, 2 = Melanic Age at Death: 0-116arrow_forwardeven though we may observe a strong relationship between the explanatory and response variables, a lurking variable may also influence the response vatiabke. This is reffered to as A. correlation B. confounding C.association D. causationarrow_forward
arrow_back_ios
SEE MORE QUESTIONS
arrow_forward_ios
Recommended textbooks for you
 MATLAB: An Introduction with ApplicationsStatisticsISBN:9781119256830Author:Amos GilatPublisher:John Wiley & Sons Inc
 Probability and Statistics for Engineering and th...StatisticsISBN:9781305251809Author:Jay L. DevorePublisher:Cengage Learning
 Statistics for The Behavioral Sciences (MindTap C...StatisticsISBN:9781305504912Author:Frederick J Gravetter, Larry B. WallnauPublisher:Cengage Learning
 Elementary Statistics: Picturing the World (7th E...StatisticsISBN:9780134683416Author:Ron Larson, Betsy FarberPublisher:PEARSON
 The Basic Practice of StatisticsStatisticsISBN:9781319042578Author:David S. Moore, William I. Notz, Michael A. FlignerPublisher:W. H. Freeman
 Introduction to the Practice of StatisticsStatisticsISBN:9781319013387Author:David S. Moore, George P. McCabe, Bruce A. CraigPublisher:W. H. Freeman

MATLAB: An Introduction with Applications
Statistics
ISBN:9781119256830
Author:Amos Gilat
Publisher:John Wiley & Sons Inc

Probability and Statistics for Engineering and th...
Statistics
ISBN:9781305251809
Author:Jay L. Devore
Publisher:Cengage Learning

Statistics for The Behavioral Sciences (MindTap C...
Statistics
ISBN:9781305504912
Author:Frederick J Gravetter, Larry B. Wallnau
Publisher:Cengage Learning

Elementary Statistics: Picturing the World (7th E...
Statistics
ISBN:9780134683416
Author:Ron Larson, Betsy Farber
Publisher:PEARSON

The Basic Practice of Statistics
Statistics
ISBN:9781319042578
Author:David S. Moore, William I. Notz, Michael A. Fligner
Publisher:W. H. Freeman

Introduction to the Practice of Statistics
Statistics
ISBN:9781319013387
Author:David S. Moore, George P. McCabe, Bruce A. Craig
Publisher:W. H. Freeman