
MATLAB: An Introduction with Applications
6th Edition
ISBN: 9781119256830
Author: Amos Gilat
Publisher: John Wiley & Sons Inc
expand_more
expand_more
format_list_bulleted
Related questions
Question
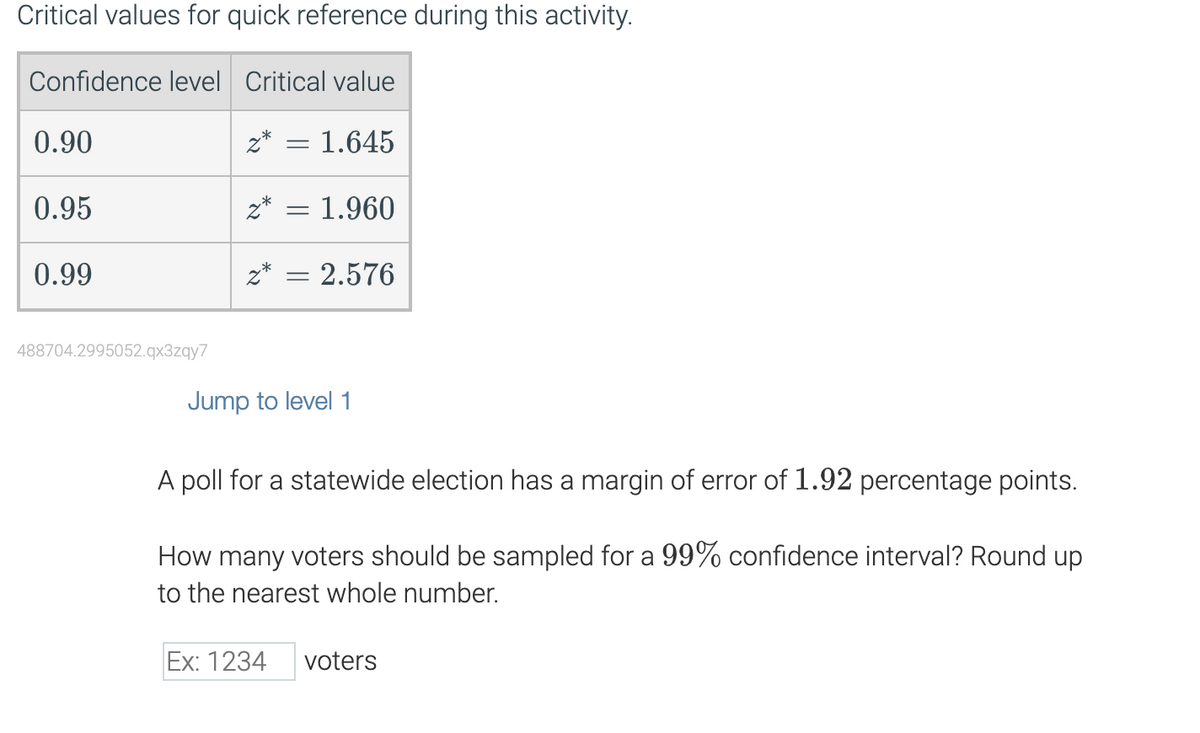
Critical values for quick reference during this activity.
| Confidence level | Critical value |
|---|---|
| 0.90 | �∗=1.645 |
| 0.95 | �∗=1.960 |
| 0.99 | �∗=2.576 |
Jump to level 1
A poll for a statewide election has a margin of error of 1.92 percentage points. How many voters should be sampled for a 99% confidence interval? Round up to the nearest whole number.
______voters

Transcribed Image Text:Critical values for quick reference during this activity.
Confidence level Critical value
1.645
0.90
0.95
0.99
488704.2995052.qx3zqy7
-
=
1.960
z* = 2.576
Jump to level 1
A poll for a statewide election has a margin of error of 1.92 percentage points.
How many voters should be sampled for a 99% confidence interval? Round up
to the nearest whole number.
Ex: 1234 voters
Expert Solution
This question has been solved!
Explore an expertly crafted, step-by-step solution for a thorough understanding of key concepts.

This is a popular solution

Trending nowThis is a popular solution!

Step by stepSolved in 3 steps with 1 images

Knowledge Booster

Similar questions
- Can you please answer questions 4,5 and 6 thanksarrow_forwardFiles Font Paragraph rStyles Voice Editor Reuse Fi BIRTH WEIGHT OF GIRLS: Use the summary statistics given: n 205, = 30.4, s = 7.1 Use a 95% confidence level and construct a confidence interval. (MUST SHOW YOUR WORK to get full credit) 19. earch 耳 | 99+arrow_forwardch9 q11arrow_forward
- Multiple choice question. Find the confidence level for an interval which has a critical value 1.05.arrow_forwardDetermine the confidence level. Determine the confidence level for confidence interval shown in the figure below. 5-10 =.10 98% 95% 90% 80% arch Cc F2 F3 F4 F5 F6 F7 F8 F9 F10 & 4. 5 * 00 %#3arrow_forwardUse the accompanying Grade Point Averages data to find 80%, 85%, and 99% confidence intervals for the mean GPA Click the icon to view the Grade Point Averages data. www An 80% confidence interval for the mean GPA is (Use ascending order. Round to two decimal places as needed.) Gender Female Female Female Female Male Female Female Female Female Female Female Female Female Male Male Female Male Female Male Female Female Female Female Female Female Female Male Female Female Male Collage Nursing Nursing Arts and Sciences Arts and Sciences Engineering Nursing Nursing Education Arts and Scances Nursing Arts and Sciences Nursing Health Science Business Business Nursing Education Education Engineering Arts and Sciences Health Science Business Health Science Nursing Engineering Education Engineering Education Nursing Engineering GPA 3.20 3.26 3.13 3,61 3.00 3.67 3.36 3.45 3.50 3.20 2.68 3.40 3.76 3.74 3.75 3.48 2.92 3.80 3.51 3.72 3.28 3.26 3.70 3.40 3,17 3.44 3.87 3.29 3.25 3.72arrow_forward
- Question Help Use the sample data and confidence level given below to complete parts (a) through (d). A research institute poll asked respondents if they felt vulnerable to identity theft. In the poll, n= 1017 and x = 524 who said "yes." Use a 99% confidence level. Click the icon to view a table of z scores. a) Find the best point estimate of the population proportion p. (Round to three decimal places as needed.) b) Identify the value of the margin of error E. E = (Round to three decimal places as needed.) c) Construct the confidence interval. Oarrow_forwardINFERENCE FOR SINGLE POPULATION PROPORTION (CONFIDENCE INTERVAL) 11. A random sample of 400 electronic components manufactured by a certain process is tested, and 30 are found to be defective. i. Let p be the proportion of defective components. Find a 95% confidence interval for p. ii. How many components must be sampled so that the 95% confidence interval will specify the proportion of defective components to within ±0.02? Source: Statistics for Engineers and Scientists, 3rd Edition, William, C. Navidi.arrow_forwardLibrary A food safety guideline is that the mercury in fish should be below 1 part per million (ppm). Listed below are the amounts of mercury (ppm) found in tuna sushi sampled at different stores in a major city. Construct a 90% confidence interval estimate of the mean amount of mercury in the population. Does it appear that there is too much mercury in tuna sushi? 0.58 0.74 0.10 0.92 1.32 0.49 0.96 t: 0 What is the confidence interval estimate of the population mean p? ppmarrow_forward
- _________ error is the difference between a sample statistic and a population parameter that occurs due to chance. Sampling Standard Statistical Humanarrow_forwardSection 05.04 Exercise 04 - Find Confidence Interval from Data (Mean Octane) Five measurements are taken of the octane rating for a particular type of gasoline. The results (in %) are 87.0, 86.0, 86.5, 93.0, and 85.3. Find a 99% confidence interval for the mean octane rating for this type of gasoline. The confidence interval for the mean octane rating for this type of gasoline is ). (Please enter the answers in ascending order.)arrow_forward
arrow_back_ios
arrow_forward_ios
Recommended textbooks for you
- MATLAB: An Introduction with ApplicationsStatisticsISBN:9781119256830Author:Amos GilatPublisher:John Wiley & Sons Inc
 Probability and Statistics for Engineering and th...StatisticsISBN:9781305251809Author:Jay L. DevorePublisher:Cengage Learning
 Statistics for The Behavioral Sciences (MindTap C...StatisticsISBN:9781305504912Author:Frederick J Gravetter, Larry B. WallnauPublisher:Cengage Learning
  Elementary Statistics: Picturing the World (7th E...StatisticsISBN:9780134683416Author:Ron Larson, Betsy FarberPublisher:PEARSON
 The Basic Practice of StatisticsStatisticsISBN:9781319042578Author:David S. Moore, William I. Notz, Michael A. FlignerPublisher:W. H. Freeman
 Introduction to the Practice of StatisticsStatisticsISBN:9781319013387Author:David S. Moore, George P. McCabe, Bruce A. CraigPublisher:W. H. Freeman
MATLAB: An Introduction with Applications
Statistics
ISBN:9781119256830
Author:Amos Gilat
Publisher:John Wiley & Sons Inc
Probability and Statistics for Engineering and th...
Statistics
ISBN:9781305251809
Author:Jay L. Devore
Publisher:Cengage Learning
Statistics for The Behavioral Sciences (MindTap C...
Statistics
ISBN:9781305504912
Author:Frederick J Gravetter, Larry B. Wallnau
Publisher:Cengage Learning
Elementary Statistics: Picturing the World (7th E...
Statistics
ISBN:9780134683416
Author:Ron Larson, Betsy Farber
Publisher:PEARSON
The Basic Practice of Statistics
Statistics
ISBN:9781319042578
Author:David S. Moore, William I. Notz, Michael A. Fligner
Publisher:W. H. Freeman
Introduction to the Practice of Statistics
Statistics
ISBN:9781319013387
Author:David S. Moore, George P. McCabe, Bruce A. Craig
Publisher:W. H. Freeman