
MATLAB: An Introduction with Applications
6th Edition
ISBN: 9781119256830
Author: Amos Gilat
Publisher: John Wiley & Sons Inc
expand_more
expand_more
format_list_bulleted
Related questions
Question
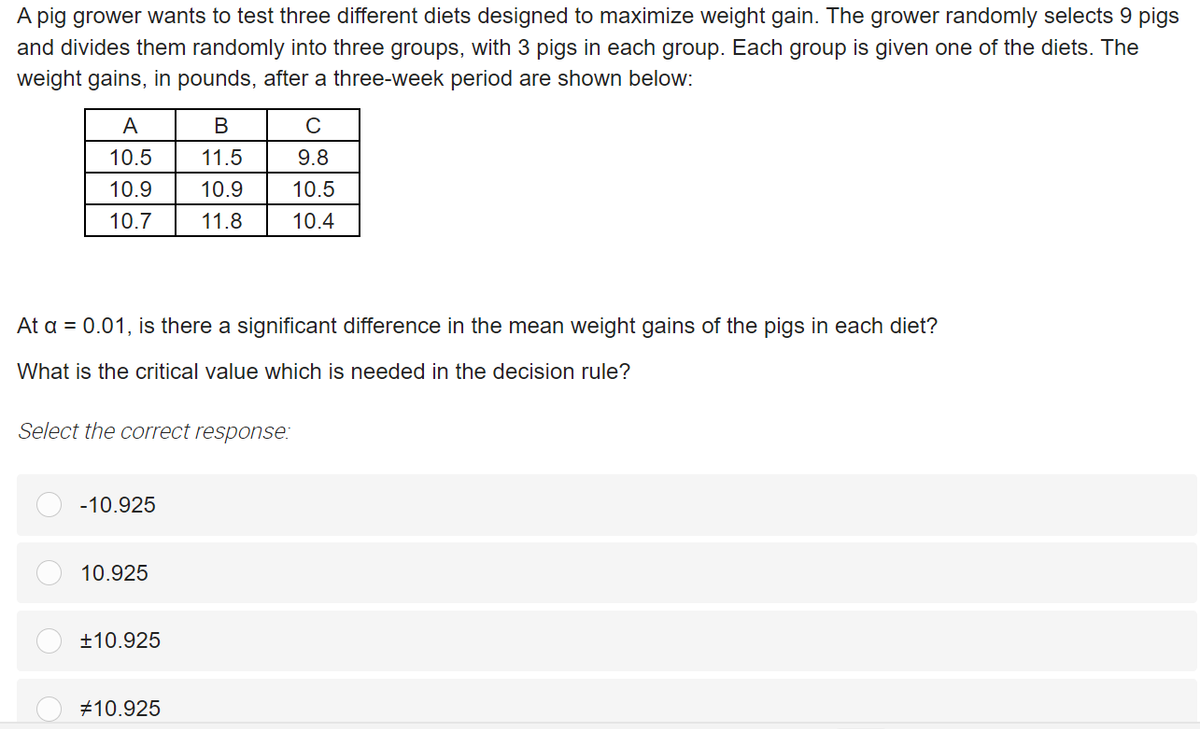

Transcribed Image Text:A pig grower wants to test three different diets designed to maximize weight gain. The grower randomly selects 9 pigs
and divides them randomly into three groups, with 3 pigs in each group. Each group is given one of the diets. The
weight gains, in pounds, after a three-week period are shown below:
A
В
10.5
11.5
9.8
10.9
10.9
10.5
10.7
11.8
10.4
At a = 0.01, is there a significant difference in the mean weight gains of the pigs in each diet?
What is the critical value which is needed in the decision rule?
Select the correct response:
-10.925
10.925
±10.925
#10.925
Expert Solution
This question has been solved!
Explore an expertly crafted, step-by-step solution for a thorough understanding of key concepts.

Step by stepSolved in 3 steps with 3 images

Knowledge Booster

Similar questions
- A researcher is investigating the effects of three different fertilizers (A, B, and C) on the growth of tomato plants. The height of the plants (in inches) is measured after one month using a sample of four plants for each fertilizer: Fertilizer A: [12, 14, 15, 13] Fertilizer B: [16, 17, 15, 18] Fertilizer C: [10, 11, 12, 9] Perform a one-way ANOVA to determine if there is a significant difference in the mean height of the tomato plants among the three fertilizers at a 5% significance level. Show all stepsarrow_forwardAn automobile dealer conducted a test to determine if the time in minutes needed to complete a minor engine tune-up depends on whether a computerized engine analyzer or an electronic analyzer is used. Because tune-up time varies among compact, intermediate, and full-sized cars, the three types of cars were used as blocks in the experiment. The data obtained follow. Analyzer Computerized Electronic Compact 50 41 Car Intermediate 56 44 Full-sized 62 47 Use a = 0.05 to test for any significant differences. State the null and alternative hypotheses. O Ho: Hcompact * HIntermediate * HFull-sized Ha: "Compact = HIntermediate = 4Full-sized O Ho: HComputerized * HElectronic Ha: HComputerized = HElectronic O Ho: HComputerized = HElectronic Ha: "Computerized * HElectronic O Ho: HComputerized = HElectronic = "Compact = HIntermediate = "Full-sized H.: Not all the population means are equal. O Ho: HCompact = HIntermediate = HFull-sized Hai H compact * HIntermediate * HFull-sized Find the value of…arrow_forwardIn a large scale study of energy conservation in single family homes, 20 homes were randomly selected from homes built in a housing development in southern England. Ten of the houses, randomly selected from the 20 houses selected for the study, were constructed with standard levels of insulation (70 mm of roof insulation and 50 mm of insulation in the walls). The other 10 houses were constructed with extra insulation (120 mm of roof insulation and 100 mm of insulation in the walls). Each house was heated with a gas furnace and energy consumption was monitored for eight years. The data shown below give annual gas consumption in MWh for each of the 20 houses. Standard Insulation Extra Insulation 13.8 15.1 17.8 13.9 18.0 15.9 17.3 17.2 16.9 15.2 19.9 13.8 13.6 11.3 17.6 13.2 15.9 18.8 12.3 14.0 Sample means Sample Standard Deviation 16.31 14.84 2.38 2.12arrow_forward
- The mango is considered the "king of fruits" in many parts of the world. Mangoes are generally harvested at the mature green stage and ripen up during the marketing process of transport, storage, and so on. During this process, about 30% of the fruit is wasted. Because of this, the impact of harvest stage and storage conditions on the postharvest quality are of interest. In this experiment, the fruit was harvested at 80, 95, or 110 days after the fruit setting (the transition from flower to fruit) and then stored at temperatures of 20∘C, 30∘C, or 40∘C. For each harvest time and storage temperature, a random sample of mangoes was selected, and the time to ripening was measured. What are the factors, the treatments, and the response variables? Take each item from the answer bank and place into the appropriate category.arrow_forwardIn a population-based cohort study, an entire community was interviewed regarding smoking habits and then followed for one year. Upon ascertainment of all lung cancer deaths, the investigator obtained the following data: Number of Individuals Lung Cancer Deaths Smokers 24,500 15 Nonsmokers 10,500 2 Calculate the risk difference per 100,000 per year. Round to the tenth decimaarrow_forwardA study is run to estimate the incidence of atrial fibrillation (AF) in men and women over the age of 60. Development of atrial fibrillation was monitored over a 10-year follow-up period. The data are summarized below. Using this data, compute the cumulative incidence of AF in men and in women respectively. Developed AF Did not Develop AF Men 133 6153 Women 79 7167arrow_forward
- In a certain study, the effect on oat yield was compared for the Pallinup, Overberg and Magnifico varieties of oats and four different concentrations of manure (0, 0.2, 0.4 and 0.6 tonnes per acre). Identify the experimental units, response variable, factor(s), levels of each factor and treatments.arrow_forwardA pharmaceutical company has developed a drug that is expected to reduce hunger. To test the drug, three samples of rats are selected with n=9 in each sample.The first sample receives the drug every day. The second sample is given the drug once a week, and the third sample receives no drug at all (the control group). These assignments of drugs are called treatments.The (dependent) variable being compared is the amount of food eaten by each rat over a 1-month period. These data are analyzed by an ANOVA, and the results are reported in the following summary table. How many groups (or population means or treatments) are being compared in this problem? _________ (Enter a whole number) What is the total number of data used in this problem? _________(Enter a whole number) Fill in all missing values in the table. (Hint: Start with the df column and your above answers.)If there are decimal places in your answer, provide 2 or more decimal places. Source of Variation SS df MS F…arrow_forwardTo evaluate the coagulation effects of three drugs, 30 healthy volunteers were randomly assigned into 3 groups and injected with different drugs. Their relevant coagulation times were measured as follows A(group=1): 36.8 34.4 34.3 35.7 33.2 31.1 34.3 29.8 35.4 31.2B(group=2): 40.0 35.5 36.7 39.3 40.1 36.8 33.4 38.3 38.4 39.8C(group=3): 32.9 37.9 30.5 31.1 34.7 37.6 40.2 38.1 32.4 35.6Questions: ① If you want to evaluate whether the coagulation effects of the three drugs are different, which method should be used? and what are the model assumptionsfor the application of this method?② Compare the difference of the coagulation effects among three drugs by SPSS,present the main results and make interpretation.③ Make pairwise comparisons of the efficacy of the three drugs, write out the method of pairwise comparison you adopted (just write one method) and the corresponding p-values.arrow_forward
arrow_back_ios
arrow_forward_ios
Recommended textbooks for you
- MATLAB: An Introduction with ApplicationsStatisticsISBN:9781119256830Author:Amos GilatPublisher:John Wiley & Sons Inc
 Probability and Statistics for Engineering and th...StatisticsISBN:9781305251809Author:Jay L. DevorePublisher:Cengage Learning
 Statistics for The Behavioral Sciences (MindTap C...StatisticsISBN:9781305504912Author:Frederick J Gravetter, Larry B. WallnauPublisher:Cengage Learning
  Elementary Statistics: Picturing the World (7th E...StatisticsISBN:9780134683416Author:Ron Larson, Betsy FarberPublisher:PEARSON
 The Basic Practice of StatisticsStatisticsISBN:9781319042578Author:David S. Moore, William I. Notz, Michael A. FlignerPublisher:W. H. Freeman
 Introduction to the Practice of StatisticsStatisticsISBN:9781319013387Author:David S. Moore, George P. McCabe, Bruce A. CraigPublisher:W. H. Freeman
MATLAB: An Introduction with Applications
Statistics
ISBN:9781119256830
Author:Amos Gilat
Publisher:John Wiley & Sons Inc
Probability and Statistics for Engineering and th...
Statistics
ISBN:9781305251809
Author:Jay L. Devore
Publisher:Cengage Learning
Statistics for The Behavioral Sciences (MindTap C...
Statistics
ISBN:9781305504912
Author:Frederick J Gravetter, Larry B. Wallnau
Publisher:Cengage Learning
Elementary Statistics: Picturing the World (7th E...
Statistics
ISBN:9780134683416
Author:Ron Larson, Betsy Farber
Publisher:PEARSON
The Basic Practice of Statistics
Statistics
ISBN:9781319042578
Author:David S. Moore, William I. Notz, Michael A. Fligner
Publisher:W. H. Freeman
Introduction to the Practice of Statistics
Statistics
ISBN:9781319013387
Author:David S. Moore, George P. McCabe, Bruce A. Craig
Publisher:W. H. Freeman