MATLAB: An Introduction with Applications
6th Edition
ISBN: 9781119256830
Author: Amos Gilat
Publisher: John Wiley & Sons Inc
expand_more
expand_more
format_list_bulleted
Question
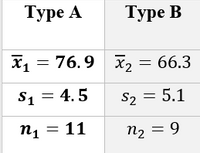
A paint manufacturer wishes to compare the drying times of two different types of paint. Independent random samples of 11 cans of type A and 9 cans of type B were selected and applied to similar surfaces. The drying times (in hours) were recorded. The summary statistics are given in the image below. Use a 0.01 significance level to test the claim that the

Transcribed Image Text:### Statistical Comparison of Type A and Type B
The table below presents a comparison of two types, namely Type A and Type B, based on their respective means, standard deviations, and sample sizes.
| | Type A | Type B |
|----------|----------|----------|
| Mean (\(\bar{x}\)) | 76.9 | 66.3 |
| Standard Deviation (\(s\)) | 4.5 | 5.1 |
| Sample Size (\(n\))| 11 | 9 |
#### Detailed Explanation:
- **Mean (\(\bar{x}\))**: This represents the average value for each type.
- Type A: The mean value is 76.9.
- Type B: The mean value is 66.3.
- **Standard Deviation (\(s\))**: This measures the amount of variation or dispersion from the mean.
- Type A: The standard deviation is 4.5, indicating less variability around the mean compared to Type B.
- Type B: The standard deviation is 5.1, indicating more variability around the mean compared to Type A.
- **Sample Size (\(n\))**: This denotes the number of observations in each sample.
- Type A: The sample size is 11.
- Type B: The sample size is 9.
The data provided can be used for various statistical analyses such as hypothesis testing, confidence interval calculations, or comparative studies to determine significant differences between Type A and Type B.

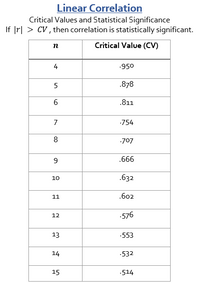
Transcribed Image Text:**Linear Correlation**
### Critical Values and Statistical Significance
*If \( |r| > CV \), then correlation is statistically significant.*
<table>
<tr>
<th>n</th>
<th>Critical Value (CV)</th>
</tr>
<tr>
<td>4</td>
<td>.950</td>
</tr>
<tr>
<td>5</td>
<td>.878</td>
</tr>
<tr>
<td>6</td>
<td>.811</td>
</tr>
<tr>
<td>7</td>
<td>.754</td>
</tr>
<tr>
<td>8</td>
<td>.707</td>
</tr>
<tr>
<td>9</td>
<td>.666</td>
</tr>
<tr>
<td>10</td>
<td>.632</td>
</tr>
<tr>
<td>11</td>
<td>.602</td>
</tr>
<tr>
<td>12</td>
<td>.576</td>
</tr>
<tr>
<td>13</td>
<td>.553</td>
</tr>
<tr>
<td>14</td>
<td>.532</td>
</tr>
<tr>
<td>15</td>
<td>.514</td>
</tr>
</table>
This table lists the critical values (CV) for a linear correlation when considering different sample sizes (n). When the absolute value of the correlation coefficient \( |r| \) exceeds the critical value (CV) corresponding to the sample size, the correlation is deemed statistically significant.
Expert Solution
This question has been solved!
Explore an expertly crafted, step-by-step solution for a thorough understanding of key concepts.
This is a popular solution
Trending nowThis is a popular solution!
Step by stepSolved in 2 steps

Knowledge Booster
Learn more about
Need a deep-dive on the concept behind this application? Look no further. Learn more about this topic, statistics and related others by exploring similar questions and additional content below.Similar questions
- Show Intro/Instructions Statistics students in Oxnard College sampled 11 textbooks in the Condor bookstore and recorded the number of pages in each textbook and its cost. The bivariate data are shown below: Number of Pages (x) Cost(y) 590 71.1 608 75.72 633 67.97 801 99.09 314 39.26 590 62.1 836 86.24 348 58.32 828 90.52 884 87.56 345 57.05 A student calculates a linear model y = (Please show your answers to two decimal places) Use the model to estimate the cost when number of pages is 788. Cost = $ (Please show your answer to 2 decimal places.) Hint: Textbook Pages Help Get Help: Points possible: 1 License This is attempt 1 of 2. II F8 F7 1) F9 F10 F1 F12 8 9 deletearrow_forwardFour brands of lightbulbs are being considered for use in the final assembly area of the Ford F-150 truck plant in Dearborn, Michigan. The director of purchasing asked for samples of 100 from each manufacturer. The numbers of acceptable and unacceptable bulbs from each manufacturer are shown below. At the .05 significance level, is there a difference in the quality of the bulbs? (Round your answers to 3 decimal places.) H0: There is no relationship between quality and manufacturer. H1: There is a relationship. 1. Reject H0 if X2 >____ 2. X2 = ____ (Reject or Do Not Reject) H0. Ther (is a/is no) relationship between quality and manufacturer.arrow_forwardSuppose IQ scores were obtained for 20 randomly selected sets of siblings. The 20 pairs of measurements yield x = 99.37, y = 98.55, r=0.859, P-value = 0.000, and y = 10.94 +0.88x, where x represents the IQ score of the older child. Find the best predicted value of y given that the older child has an IQ of 105? Use a significance level of 0.05. 10CritPearson.pdf O A. 98.55 OB. 0.88 O C. 99.37 O D. 103.34arrow_forward
- Individual actions can play a large role in the overall health of our planet. A researcher interested in evaluating environment friendly behaviors evaluated how often people recycle (per month) based on whether they have an overall optimistic or an overall pessimistic attitude toward eco-friendly behaviors. The results from this hypothetical study are given in the table. Test whether or not recycling behaviors differed between groups using a .05 level of significance. State the value of the test statistics and the decision to retain or reject the null hypothesis. Compute effect size using eta- squared (n^2). Pessimistic Optimistic 3 4 0 9 4 6 2 8 1 9 6 5 3 6 5 8 0 6 5 7arrow_forwardA teacher would like to determine if quiz scores improve after completion of a worksheet. The students take a pre-quiz before the worksheet and then another quiz after the worksheet. (Pre-quiz score - Post-quiz score) Assume quiz scores are normally distributed. The grades for each quiz are given below. Use a significance level of a = 0.05. H₂: Hd = 0 Ha: Hd <0 pre-quiz 12 16 17 16 11 15 12 7 15 13 post-quiz 13 16 15 16 14 15 13 9 14 15 What is the test statistic? test statistic = (Report answer accurate to 2 decimal places.) What is the p-value for this sample? p-value= (Report answer accurate to 3 decimal places.) The correct decision is to Select an answer Conclusion: Select an answer that the worksheet improved quiz scores.arrow_forwardAcne is a common skin disease that affects most adolescents and can continue into adulthood. A study compared the effectiveness of three acne treatments and a placebo, all in gel form, applied twice daily for 12 weeks. The study's 517 teenage volunteers were randomly assigned to one of the four treatments. Success was assessed as clear or almost clear skin at the end of the 12 week period. The results of the study can be seen in the table below. Using the appropriate statistical test, determine if there is significant evidence that the four treatments perform differently. If so, how do they compare.arrow_forward
- Bone mineral density (BMD) is a measure of bone strength. Studies show that BMD declines after age 45. The impact of exercise may increase BMD. A random sample of 59 women between the ages of 41 and 45 with no major health problems were studied. The women were classified into one of two groups based upon their level of exercise activity: walking women and sedentary women. The 39 women who walked regularly had a mean BMD of 5.96 with a standard deviation of 1.22. The 20 women who are sedentary had a mean BMD of 4.41 with a standard deviation of 1.02. Which of the following inference procedures could be used to estimate the difference in the mean BMD for these two types of womenarrow_forwardSuppose IQ scores were obtained for 20 randomly selected sets of couples. The 20 pairs of measurements yield x= 100.1, y = 98.3, r=0.961, P-value = 0.000, and y = - 18.02 + 1.16x, where x represents the IQ score of the wife. Find the best predicted value of y given that the wife has an IQ of 100? Use a significance level of 0.05. Click the icon to view the critical values of the Pearson correlation coefficient r. The best predicted value of y is (Round to two decimal places as needed.)arrow_forwardSuppose IQ scores were obtained for 20 randomly selected sets of siblings. The 20 pairs of measurements yield x=99.75, y=101, r=0.921, P-value=0.000, and y=2.6+0.99x, where x represents the IQ score of the older child. Find the best predicted value of y given that the older child has an IQ of 102? Use a significance level of 0.05.arrow_forward
- An immunologist wants to compare two rabies vaccines. People who had previously received the vaccine were divided into two groups. The first group received a booster dose of type I vaccine and the second group received a booster dose of type II vaccine. Two weeks later the antibody level was measured. The average number of antibodies in each group appears in the following table Do these data indicate that there is a difference in the effectiveness of the two vaccines used for booster doses? Assume a normal distribution and equal population variances. The test statistic that will determine if there is a difference in the effectiveness of the two vaccines..... A. 2,579 B. 2.76 C. 0.58 D. 0.787arrow_forwardThe valve pressure was tested on 250 engines and the mean pressure was 5.9 lbs/square inch. Assume the variance is known to be 0.36. If the valve was designed to produce a mean pressure of 5.8 lbs/square inch, is there sufficient evidence at the 0.02 level that the valve performs about the specifications?arrow_forward
arrow_back_ios
arrow_forward_ios
Recommended textbooks for you
 MATLAB: An Introduction with ApplicationsStatisticsISBN:9781119256830Author:Amos GilatPublisher:John Wiley & Sons Inc
 Probability and Statistics for Engineering and th...StatisticsISBN:9781305251809Author:Jay L. DevorePublisher:Cengage Learning
 Statistics for The Behavioral Sciences (MindTap C...StatisticsISBN:9781305504912Author:Frederick J Gravetter, Larry B. WallnauPublisher:Cengage Learning
 Elementary Statistics: Picturing the World (7th E...StatisticsISBN:9780134683416Author:Ron Larson, Betsy FarberPublisher:PEARSON
 The Basic Practice of StatisticsStatisticsISBN:9781319042578Author:David S. Moore, William I. Notz, Michael A. FlignerPublisher:W. H. Freeman
 Introduction to the Practice of StatisticsStatisticsISBN:9781319013387Author:David S. Moore, George P. McCabe, Bruce A. CraigPublisher:W. H. Freeman

MATLAB: An Introduction with Applications
Statistics
ISBN:9781119256830
Author:Amos Gilat
Publisher:John Wiley & Sons Inc

Probability and Statistics for Engineering and th...
Statistics
ISBN:9781305251809
Author:Jay L. Devore
Publisher:Cengage Learning

Statistics for The Behavioral Sciences (MindTap C...
Statistics
ISBN:9781305504912
Author:Frederick J Gravetter, Larry B. Wallnau
Publisher:Cengage Learning

Elementary Statistics: Picturing the World (7th E...
Statistics
ISBN:9780134683416
Author:Ron Larson, Betsy Farber
Publisher:PEARSON

The Basic Practice of Statistics
Statistics
ISBN:9781319042578
Author:David S. Moore, William I. Notz, Michael A. Fligner
Publisher:W. H. Freeman

Introduction to the Practice of Statistics
Statistics
ISBN:9781319013387
Author:David S. Moore, George P. McCabe, Bruce A. Craig
Publisher:W. H. Freeman