A First Course in Probability (10th Edition)
10th Edition
ISBN: 9780134753119
Author: Sheldon Ross
Publisher: PEARSON
expand_more
expand_more
format_list_bulleted
Question
Please clearly state the formulas used and the complete solution. Thank you!

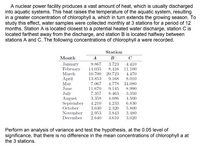
Transcribed Image Text:A nuclear power facility produces a vast amount of heat, which is usually discharged
into aquatic systems. This heat raises the temperature of the aquatic system, resulting
in a greater concentration of chlorophyll a, which in turn extends the growing season. To
study this effect, water samples were collected monthly at 3 stations for a period of 12
months. Station A is located closest to a potential heated water discharge, station C is
located farthest away from the discharge, and station B is located halfway between
stations A and C. The following concentrations of chlorophyll a were recorded.
Station
Month
A B
January
February
9.867
14.035
10.700 20.723
3.723
4.410
8.416 11.100
4.470
8.010
4.778 34.080
8.990
3.350
4.500
March
Аpril
May
June
13.853
7.067
11.670
7.357
9.168
9.145
July
August
September
October
November
December
8.463
4.086
3.358
4.210
4.233
6.830
3.630
2.320
5.800
2.953
2.640
3.843
3.610
3.480
3.020
Perform an analysis of variance and test the hypothesis, at the 0.05 level of
significance, that there is no difference in the mean concentrations of chlorophyll a at
the 3 stations.
Expert Solution
This question has been solved!
Explore an expertly crafted, step-by-step solution for a thorough understanding of key concepts.
This is a popular solution
Trending nowThis is a popular solution!
Step by stepSolved in 2 steps

Knowledge Booster
Similar questions
arrow_back_ios
arrow_forward_ios
Recommended textbooks for you
 A First Course in Probability (10th Edition)ProbabilityISBN:9780134753119Author:Sheldon RossPublisher:PEARSON

A First Course in Probability (10th Edition)
Probability
ISBN:9780134753119
Author:Sheldon Ross
Publisher:PEARSON
