
MATLAB: An Introduction with Applications
6th Edition
ISBN: 9781119256830
Author: Amos Gilat
Publisher: John Wiley & Sons Inc
expand_more
expand_more
format_list_bulleted
Related questions
Question
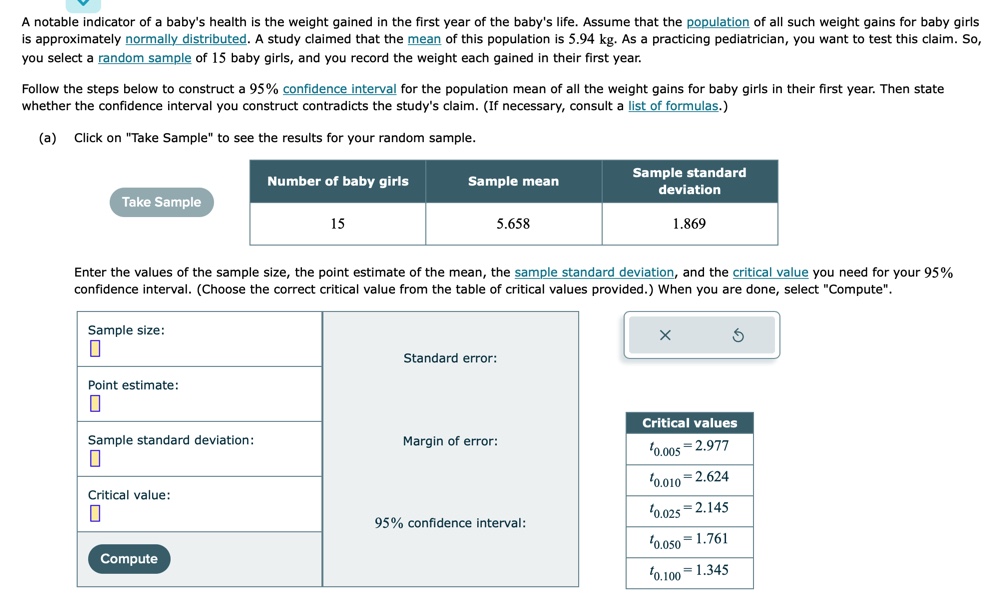

Transcribed Image Text:A notable indicator of a baby's health is the weight gained in the first year of the baby's life. Assume that the population of all such weight gains for baby girls
is approximately normally distributed. A study claimed that the mean of this population is 5.94 kg. As a practicing pediatrician, you want to test this claim. So,
you select a random sample of 15 baby girls, and you record the weight each gained in their first year.
Follow the steps below to construct a 95% confidence interval for the population mean of all the weight gains for baby girls in their first year. Then state
whether the confidence interval you construct contradicts the study's claim. (If necessary, consult a list of formulas.)
(a) Click on "Take Sample" to see the results for your random sample.
Take Sample
Sample size:
0
Point estimate:
0
Sample standard deviation:
10
Critical value:
0
Number of baby girls
Compute
15
Enter the values of the sample size, the point estimate of the mean, the sample standard deviation, and the critical value you need for your 95%
confidence interval. (Choose the correct critical value from the table of critical values provided.) When you are done, select "Compute".
Sample mean
5.658
Standard error:
Margin of error:
Sample standard
deviation
95% confidence interval:
1.869
X
Critical values
¹0.005 2.977
¹0.010 2.624
10.025 2.145
10.050 1.761
¹0.100=1.345

Transcribed Image Text:(b) Based on your sample, graph the 95% confidence interval for the population mean of all the weight gains for baby girls in their first year.
• Enter the values for the lower and upper limits on the graph to show your confidence interval.
• For the point (), enter the claim 5.94 from the study.
(c)
0.000
0.000
2,000
95% confidence interval:
4.000
5.000
6.000
8.000
Does the 95% confidence interval you constructed contradict the claim made by the study?
Choose the best answer from the choices below.
10.000
10.000
Ś
O No, the confidence interval does not contradict the claim. The mean of 5.94 kg from the study is inside the 95%
confidence interval.
O No, the confidence interval does not contradict the claim. The mean of 5.94 kg from the study is outside the 95%
confidence interval.
Yes, the confidence interval contradicts the claim. The mean of 5.94 kg from the study is inside the 95% confidence
interval.
Yes, the confidence interval contradicts the claim. The mean of 5.94 kg from the study is outside the 95%
confidence interval.
X
3
Expert Solution
This question has been solved!
Explore an expertly crafted, step-by-step solution for a thorough understanding of key concepts.

This is a popular solution

Trending nowThis is a popular solution!

Step by stepSolved in 4 steps with 1 images

Knowledge Booster

Similar questions
- The life span in Honolulu is approximately normally distributed. The mean life span is 77 years. A foreign newspaper claims that the mean lifespan for Honolulu residents is less than 77 years. You randomly select a sample of 20 obituary notices in a Honolulu newspaper. The table below shows the data collected (in years). 72 68 81 93 56 19 78 94 83 84 77 69 85 97 75 71 86 47 66 27 Use the graphing calculator to find the test statistic.arrow_forwardThe table below shows the frequency of AP Physics scores for a high school class. AP Score Frequency 11 6 22 7 33 5 44 1 55 6 Find the mean and median. A. Mean = 2.76 and Median = 7 B. Mean = 4.6 and Median = 2 C. Mean = 4.6 and Median = 3 D. Mean = 2.76 and Median = 2 E. Mean = 1.67 and Median = 1arrow_forwardUse a standard normal table to find the z-score that corresponds to the 5th percentile. Click to view page 1 of the table. Click to view page 2 of the table. OA. 4 B. 0.00 O C. - 1.645 O D. -2.575arrow_forward
- Roll a pair of die 36 times, and draw a bar graph of all the outcomes. Using the data, find the mean, the variance, and the standard deviation for this model.arrow_forwardshould have the right to marry. (The 2014 data were collected before the 2015 U.S. C2. GSS 2014 and GSS 2018 respondents were asked their opinion on whether homosexuals 30 measured on a 5-point scale from strongly agree (1) to strongly disagree (5). Supreme Court decision granting same-sex couples the right to marry. Responses wer measured on a 5-point scale from strongly agree (1) to strong!y aisagiee (2). Cumulative Percentage Homosexuals Should Have Right to Marry (2014) Percentage Frequency 32.5 32.5 Strongly agree 251 57.5 25.2 Agree 195 67.3 Neither agree nor disagree 9.6 74 79.2 Disagree 92 11.9 100.0 Strongly disagree 161 20.8 Total 773 100.0 Homosexuals Should Have Cumulative Right to Marry (2018) Frequency Percentage Percentage Strongly agree 293 39.5 39.5 Agree 200 27.0 66.5 Neither agree nor disagree 70 9.4 75.9 Disagree 67 9.0 84.9 Strongly disagree 111 15.0 99.9 Total 741 99.9 a. What is the level of measurement for this variable? b. What is the mode for 2014? For 2018?arrow_forwardBecause colas tend to replace healthier beverages and colas contain caffeine and phosphoric acid, researchers wanted to know whether cola consumption is associated with lower bone mineral density in women. The accompanying data lists the typical number of cans of cola consumed in a week and the femoral neck bone mineral density for a sample of 15 women. Complete parts (a) through (f) below. Click the icon to view the women's data. (a) Find the leas ŷ=x+ X (Round to four d Colas per Week and Bone Density colas per week 0 0 1 1 2 2 33556670 4 8 Bone Mineral Density (g/cm³) 0.908 0.896 0.887 0.877 0.866 0.850 0.829 0.836 0.815 0.800 0.795 0.773 0.771 0.760 0.735 Xarrow_forward
- Regan is interested in comparing the outdoor activity of people from different parts of the country. He collects data from people from the East Coast, Midwest, and West Coast and assesses how many minutes per day they spend exercising. What test. should i use? ANOVA Paired samples t test Independent samples t test Correlationarrow_forwardThis histogram shows the heights of 20 students in a statistics class. Explain why it is not appropriate to find summary statistics for this distribution. Frequency 4- 3- 2- 1- T 0+ 60 65 70 75 Height (Inches) Choose the correct answer below. OA. Since there appear to be two modes, this data probably represents men and women and should be split into those two groups before finding any summary statistics. OB. The number of data values is too small for summary statistics to be meaningful. OC. Since the data appear to be bimodal, no other measures of center or spread can be calculated. OD. Since the distribution is not symmetric, summary statistics would be meaningless.arrow_forwardListed below are pulse rates (beats per minute) from samples of adult males and females. Find the mean and median for each of the two samples and then compare the two sets of results. Does there appear to be a difference? 86 Male: 73 90 52 57 64 63 55 97 64 95 54 93 61 60 Female: 68 88 93 90 79 65 85 62 91 92 73 90 78 82 75 D C Find the means. The mean for males is beats per minute and the mean for females is beats per minute. (Type integers or decimals rounded to one decimal place as needed.)arrow_forward
- The first step in a Wilcaxon rank sum test is to combine the data values in the two samples and assign a rank of 1 to the: observation that occurs most frequently. middle observation. O largest observation. smallest observation.arrow_forwardIn a study conducted to examine the quality of fish after 7 days in ice storage, ten raw fish of the same kind and approximately the same size were caught and prepared for ice storage. The fish were placed in ice storage at different times after being caught. A measure of fish quality was given to each fish after 7 days in ice storage. The sample data are shown below, where "Time" is the number of hours after being caught that the fish was placed in ice storage and "Fish Quality" is the measure given to each fish after 7 days in ice storage (higher numbers mean better quality). Which variable would be considered the response variable? Fish Time: 0 0 2 3 5 6 7 9 11 12 Fish Quality 8.5 8.4 8.0 8.1 7.8 7.6 7.3 7.0 6.8 6.7 Choose the correct answer below. A.Fish Quality B.Time C.Neither variable could be considered a response variable.arrow_forwardThe table below shows the frequency of AP Biology scores for a high school class. AP Score Frequency 1 5 2 7 3 6 4 4 5 3 Find the mean and median. Mean = 1.67 and Median = 2 Mean = 2.72 and Median = 3 Mean = 2.72 and Median = 7 Mean = 4.53 and Median = 4 Mean = 4.53 and Median = 3arrow_forward
arrow_back_ios
SEE MORE QUESTIONS
arrow_forward_ios
Recommended textbooks for you
- MATLAB: An Introduction with ApplicationsStatisticsISBN:9781119256830Author:Amos GilatPublisher:John Wiley & Sons Inc
 Probability and Statistics for Engineering and th...StatisticsISBN:9781305251809Author:Jay L. DevorePublisher:Cengage Learning
 Statistics for The Behavioral Sciences (MindTap C...StatisticsISBN:9781305504912Author:Frederick J Gravetter, Larry B. WallnauPublisher:Cengage Learning
  Elementary Statistics: Picturing the World (7th E...StatisticsISBN:9780134683416Author:Ron Larson, Betsy FarberPublisher:PEARSON
 The Basic Practice of StatisticsStatisticsISBN:9781319042578Author:David S. Moore, William I. Notz, Michael A. FlignerPublisher:W. H. Freeman
 Introduction to the Practice of StatisticsStatisticsISBN:9781319013387Author:David S. Moore, George P. McCabe, Bruce A. CraigPublisher:W. H. Freeman
MATLAB: An Introduction with Applications
Statistics
ISBN:9781119256830
Author:Amos Gilat
Publisher:John Wiley & Sons Inc
Probability and Statistics for Engineering and th...
Statistics
ISBN:9781305251809
Author:Jay L. Devore
Publisher:Cengage Learning
Statistics for The Behavioral Sciences (MindTap C...
Statistics
ISBN:9781305504912
Author:Frederick J Gravetter, Larry B. Wallnau
Publisher:Cengage Learning
Elementary Statistics: Picturing the World (7th E...
Statistics
ISBN:9780134683416
Author:Ron Larson, Betsy Farber
Publisher:PEARSON
The Basic Practice of Statistics
Statistics
ISBN:9781319042578
Author:David S. Moore, William I. Notz, Michael A. Fligner
Publisher:W. H. Freeman
Introduction to the Practice of Statistics
Statistics
ISBN:9781319013387
Author:David S. Moore, George P. McCabe, Bruce A. Craig
Publisher:W. H. Freeman