
MATLAB: An Introduction with Applications
6th Edition
ISBN: 9781119256830
Author: Amos Gilat
Publisher: John Wiley & Sons Inc
expand_more
expand_more
format_list_bulleted
Related questions
Question
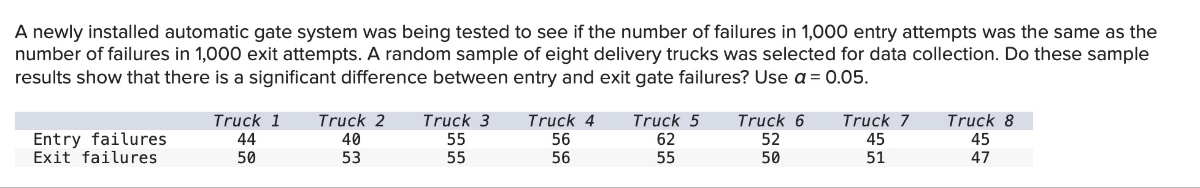

Transcribed Image Text:A newly installed automatic gate system was being tested to see if the number of failures in 1,000 entry attempts was the same as the
number of failures in 1,000 exit attempts. A random sample of eight delivery trucks was selected for data collection. Do these sample
results show that there is a significant difference between entry and exit gate failures? Use a = 0.05.
Entry failures
Exit failures
Truck 1 Truck 2
Truck 3
Truck 4
Truck 5
44
40
55
56
62
Truck 6
52
Truck 7
Truck 8
50
53
55
56
55
50
45
51
45
47
Expert Solution
This question has been solved!
Explore an expertly crafted, step-by-step solution for a thorough understanding of key concepts.

This is a popular solution

Trending nowThis is a popular solution!

Step by stepSolved in 3 steps with 5 images

Knowledge Booster

Similar questions
- Consider the following sample data: 6, 10, 4, 3, 7, 9, 21, and 14. What is the variance? Select one: a. 34.79 b. 33.56 c. 34.21 d. 34.02arrow_forwardCourse/Year 1. Brian, a college administrator, claimed that there was no difference in averages of students coming from three nearby schools A, B, and C. Use the following data to test his claim with a 1% significance level. Ex A-420 2x² 253 Ex B 340 SANOVA Table: 4 Source of Variation Between - column Within - column Total A A. Ho: B. a: 0.01 C. B C 3 _M₁ = M₁₂₁ = M²3 Sum of Squares 2.25 Compute for sum of squares D. Compute for degrees of freedom 84 88 88 E. Compute for mean sum of squares F. Compute for F-value 82 83 80 df 2 Ha: STUDENTS 89 82 89 Mean Sum of Squares 85 83 80 F-value Mr & Mr & M²₂ n₁ = √=n²₁₂₁ = 3 - N = 12 7 Critical Value / Tabular Value Decisionarrow_forwardA researcher is studying the effects of the college experience on attitudes, values, and behaviors and is comparing random samples of freshman and seniors at the same university. Is there a significant difference in political ideology? (On this scale, 10 means "very conservative" and 1 means "very liberal") FRESHMAN SENIORSmean=5.23 mean=5.12s=1.78 s=1.07N=145 N=105arrow_forward
- Periodically, customers of a financial services company are asked to evaluate the company's financial consultants and services. Higher ratings on the client satisfaction survey indicate better service, with 7 the maximum service rating. Independent samples of service ratings for two financial consultants are summarized here. Consultant A has 10 years of experience, whereas consultant B has 1 year of experience. Use ? = 0.05 and test to see whether the consultant with more experience has the higher population mean service rating. Assume the population variances are unequal. Consultant A Consultant B n1 = 16 n2 = 10 x1 = 6.85 x2 = 6.25 s1 = 0.69 s2 = 0.75 (a) State the null and alternative hypotheses. -H0:?1 − ?2 = 0 Ha:?1 − ?2 = 0 -H0:?1 − ?2 > 0 Ha:?1 − ?2 = 0 -H0:?1 − ?2 ≠ 0 Ha:?1 − ?2 = 0 -H0:?1 − ?2 = 0 Ha:?1 − ?2 > 0 -H0:?1 − ?2 = 0 Ha:?1 − ?2 ≠ 0 (b) Compute the value of the test statistic. (Round your answer to three decimal places.)…arrow_forwardA district health officer wishes to determine if the six villages in his district are independent of residents contracting malaria, schistosomiasis, cholera or tuberculosis. Identity an appropriate statistical test and the tail of the test for the problem. Assume all samples used for study come from a normal population.arrow_forwarddults aged 18 years old and older were randomly selected for a survey on obesity. Adults are considered obese if their body mass index (BMI) is at least 30. The researchers wanted to determine if the proportion of southern women who are obese is less than the proportion of southern men who are obese. The results are shown in the table below. Test at the 1% level of significance. Number who are obese Sample size Men 42,773 155,525 Women 67,176 248,775 a.State the distribution to use for the test. (Round your answers to five decimal places. b. What is the test statistic c. Conduct a Hypothesis Testarrow_forward
- Customers of a restaurant have been complaining about food poisoning over the past week. A health professional was called to investigate. He tested a representative sample of the eggs and reported that 23% of the sample eggs tested positive for the salmonella bacterium. If a second health professional tests 4 eggs at random, what is the mean of the number of eggs that test positive for salmonella?arrow_forwardAn athletic shoemaker wants to test if their new running shoe specially made for sprinting is better than the competition. To do this, they recruit 35 NCAA sprinters and time their 100-meter dash wearing the company's shoe and then time their 100-meter dash again wearing the competitor’s shoe. The difference of these times is then calculated asTimecompany.shoe−Timecompetitor.shoe. The sample mean difference in times is 0.53 seconds and the sample standard deviation is 1.1. Conduct a hypothesis test at theα=0.1 level. (a) Set up the null and alternative hypothesis (using mathematical notation/numbers AND interpret them in the context of the problem) (b) Calculate the test statistic (c) Calculate the critical value. (d) Draw a picture of the distribution of the test statistic underH0. Label and provide values for the critical value and the test statistic, and shade the critical region. (e) Make and justify a statistical decision at theα= 0.15 level and state your conclusions in the…arrow_forwardThis is about ANOVA: 1. What does one-way mean? 2. What does between-subjects mean? 3. A researcher conducts a one-way ANOVA with four levels. How many different groups are in this study? 4. What are the two sources of variability for the one-way ANOVA?arrow_forward
arrow_back_ios
arrow_forward_ios
Recommended textbooks for you
- MATLAB: An Introduction with ApplicationsStatisticsISBN:9781119256830Author:Amos GilatPublisher:John Wiley & Sons Inc
 Probability and Statistics for Engineering and th...StatisticsISBN:9781305251809Author:Jay L. DevorePublisher:Cengage Learning
 Statistics for The Behavioral Sciences (MindTap C...StatisticsISBN:9781305504912Author:Frederick J Gravetter, Larry B. WallnauPublisher:Cengage Learning
  Elementary Statistics: Picturing the World (7th E...StatisticsISBN:9780134683416Author:Ron Larson, Betsy FarberPublisher:PEARSON
 The Basic Practice of StatisticsStatisticsISBN:9781319042578Author:David S. Moore, William I. Notz, Michael A. FlignerPublisher:W. H. Freeman
 Introduction to the Practice of StatisticsStatisticsISBN:9781319013387Author:David S. Moore, George P. McCabe, Bruce A. CraigPublisher:W. H. Freeman
MATLAB: An Introduction with Applications
Statistics
ISBN:9781119256830
Author:Amos Gilat
Publisher:John Wiley & Sons Inc
Probability and Statistics for Engineering and th...
Statistics
ISBN:9781305251809
Author:Jay L. Devore
Publisher:Cengage Learning
Statistics for The Behavioral Sciences (MindTap C...
Statistics
ISBN:9781305504912
Author:Frederick J Gravetter, Larry B. Wallnau
Publisher:Cengage Learning
Elementary Statistics: Picturing the World (7th E...
Statistics
ISBN:9780134683416
Author:Ron Larson, Betsy Farber
Publisher:PEARSON
The Basic Practice of Statistics
Statistics
ISBN:9781319042578
Author:David S. Moore, William I. Notz, Michael A. Fligner
Publisher:W. H. Freeman
Introduction to the Practice of Statistics
Statistics
ISBN:9781319013387
Author:David S. Moore, George P. McCabe, Bruce A. Craig
Publisher:W. H. Freeman