
MATLAB: An Introduction with Applications
6th Edition
ISBN: 9781119256830
Author: Amos Gilat
Publisher: John Wiley & Sons Inc
expand_more
expand_more
format_list_bulleted
Related questions
Question
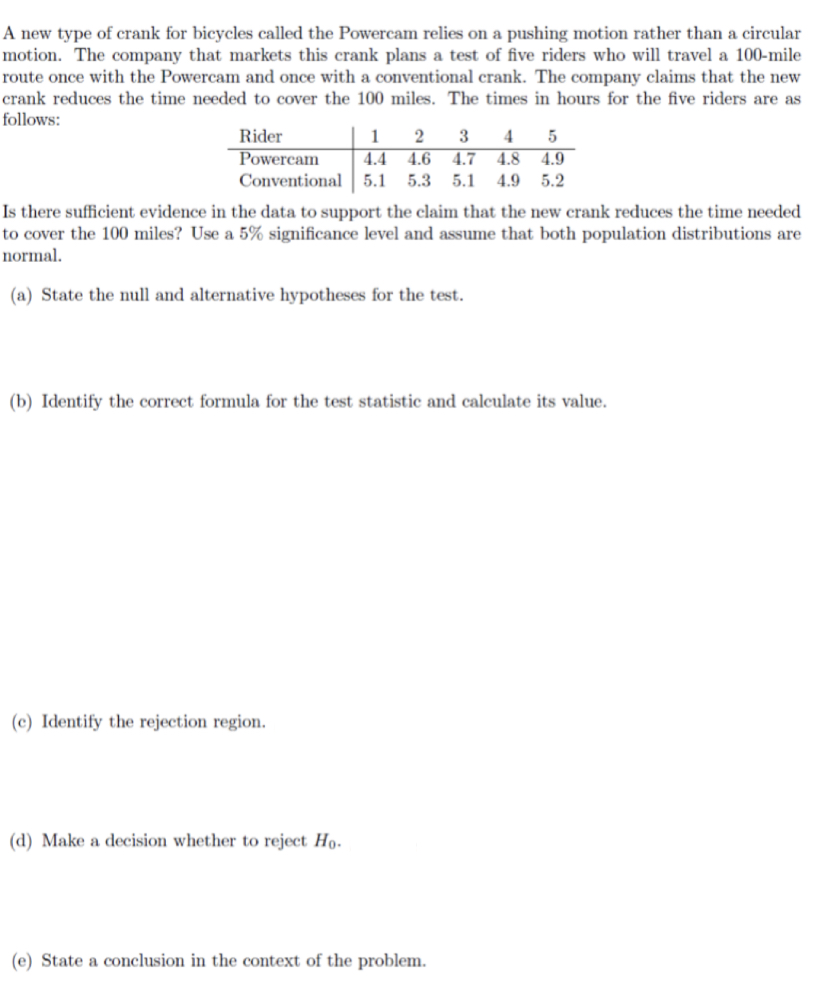

Transcribed Image Text:A new type of crank for bicycles called the Powercam relies on a pushing motion rather than a circular
motion. The company that markets this crank plans a test of five riders who will travel a 100-mile
route once with the Powercam and once with a conventional crank. The company claims that the new
crank reduces the time needed to cover the 100 miles. The times in hours for the five riders are as
follows:
Rider
Powercam
Conventional 5.1
1
4
4.4
4.6
4.7
4.8
4.9
5.3 5.1
4.9 5.2
Is there sufficient evidence in the data to support the claim that the new crank reduces the time needed
to cover the 100 miles? Use a 5% significance level and assume that both population distributions are
normal.
(a) State the null and alternative hypotheses for the test.
(b) Identify the correct formula for the test statistic and calculate its value.
(c) Identify the rejection region.
(d) Make a decision whether to reject Ho.
(e) State a conclusion in the context of the problem.
Expert Solution
This question has been solved!
Explore an expertly crafted, step-by-step solution for a thorough understanding of key concepts.

This is a popular solution

Trending nowThis is a popular solution!

Step by stepSolved in 4 steps with 4 images

Knowledge Booster


Learn more about
Need a deep-dive on the concept behind this application? Look no further. Learn more about this topic, statistics and related others by exploring similar questions and additional content below.Similar questions
- Janey answered 80% of the 30 questions on an online physics quiz correctly. How many problems on the quiz did she answer correctly? A.24 B.12 C.50 D.6arrow_forwardA ship is 2.3 off course. If the ship is traveling at 11 miles per hour, how far off course will it be after 3 hours? Round answer to one decimal place. Do not include units in your answer. You must show work on a separate sheet of paper to receive credit.arrow_forwardMike’s class is building a model of the new One World Trade Center (OWTC) in New York City. They used a scale of 0.005 for their model; that is, each measure of the actual building is multiplied by 0.005 to find the measure of the corresponding part on the model. If the height of the OWTC is 1776 ft, what is the height of the model?arrow_forward
- A. 65 mphB. 70.2 mphC. 82.6 mphD. 85.4 mpharrow_forwardA map of Levi’s trip is being made with a scale of 2 centimeters : 30 miles. How many centimeters will a 315 mile trip be on his map?arrow_forwardA scale was used to convert the actual height of a roller coaster track to the height shown in the picture below. The actual height of the track is 66 meters. Which scale could have been used to determine the height of the track in the picture? A. 1 cm = 66 m B. 1 cm = 33 m C. 1 cm = 11 m D. 1 cm = 6 marrow_forward
- A group of students measured their weight during P.E .Austin weighs 78.8 pounds .Katie weighs 0.5 more than Austin .Mario weighs 1.35 pounds how many pounds do Katie and Mario weigh combinedarrow_forwardC. 314 d. 348 4. Ginise bought two pieces of wood in lengths of 72 inches and 104 inches. She needs to cut the wood into pieces of equal length. What is the greatest possible length of the pieces? Please don't handwriting solutionarrow_forwardEn7x3=D17,144 3. A company designs a billboard to advertise their grand opening. They used a scale of 1 in. : 10 ft. What would be the dimensions of the billboard in the drawing if they use a scale of 2 in. : 25 ft instead? 10 in. 36 8 in. 20 Copyright © by Pearson Educatioarrow_forward
- Perform an experiment of dropping a pencil/ballpoint at a specific target on the floor. Identify which height and orientation is closest to the target point by measuring the distance (cm) of the dropped object to the target. Use below data for the different levels for the two factors: Factor A: Height | Factor B: Orientation Low Level 4 ft vertical High Level 5 ft horizontalarrow_forwardSamantha is estimating the width of a lake. She stands at point B and looks through a long-range scope. She sees a boat shed at point A that is about 9 miles away and a tall tree at point C that is about 7 miles away. Which of the following is closest to the distance, in miles, across the lake from point A to point C? 12.9 9.7 10.6 11.4arrow_forwardTyler looks at a map on his phone. He zooms in until the map scale for cenimeters to kilometers 0.3:1/5. How many cenimeters does this map use to show 1 kilometer?arrow_forward
arrow_back_ios
SEE MORE QUESTIONS
arrow_forward_ios
Recommended textbooks for you
- MATLAB: An Introduction with ApplicationsStatisticsISBN:9781119256830Author:Amos GilatPublisher:John Wiley & Sons Inc
 Probability and Statistics for Engineering and th...StatisticsISBN:9781305251809Author:Jay L. DevorePublisher:Cengage Learning
 Statistics for The Behavioral Sciences (MindTap C...StatisticsISBN:9781305504912Author:Frederick J Gravetter, Larry B. WallnauPublisher:Cengage Learning
  Elementary Statistics: Picturing the World (7th E...StatisticsISBN:9780134683416Author:Ron Larson, Betsy FarberPublisher:PEARSON
 The Basic Practice of StatisticsStatisticsISBN:9781319042578Author:David S. Moore, William I. Notz, Michael A. FlignerPublisher:W. H. Freeman
 Introduction to the Practice of StatisticsStatisticsISBN:9781319013387Author:David S. Moore, George P. McCabe, Bruce A. CraigPublisher:W. H. Freeman
MATLAB: An Introduction with Applications
Statistics
ISBN:9781119256830
Author:Amos Gilat
Publisher:John Wiley & Sons Inc
Probability and Statistics for Engineering and th...
Statistics
ISBN:9781305251809
Author:Jay L. Devore
Publisher:Cengage Learning
Statistics for The Behavioral Sciences (MindTap C...
Statistics
ISBN:9781305504912
Author:Frederick J Gravetter, Larry B. Wallnau
Publisher:Cengage Learning
Elementary Statistics: Picturing the World (7th E...
Statistics
ISBN:9780134683416
Author:Ron Larson, Betsy Farber
Publisher:PEARSON
The Basic Practice of Statistics
Statistics
ISBN:9781319042578
Author:David S. Moore, William I. Notz, Michael A. Fligner
Publisher:W. H. Freeman
Introduction to the Practice of Statistics
Statistics
ISBN:9781319013387
Author:David S. Moore, George P. McCabe, Bruce A. Craig
Publisher:W. H. Freeman