
Essentials Of Investments
11th Edition
ISBN: 9781260013924
Author: Bodie, Zvi, Kane, Alex, MARCUS, Alan J.
Publisher: Mcgraw-hill Education,
expand_more
expand_more
format_list_bulleted
Related questions
Question
Capital Investment Analysis: Continental Railroad Company
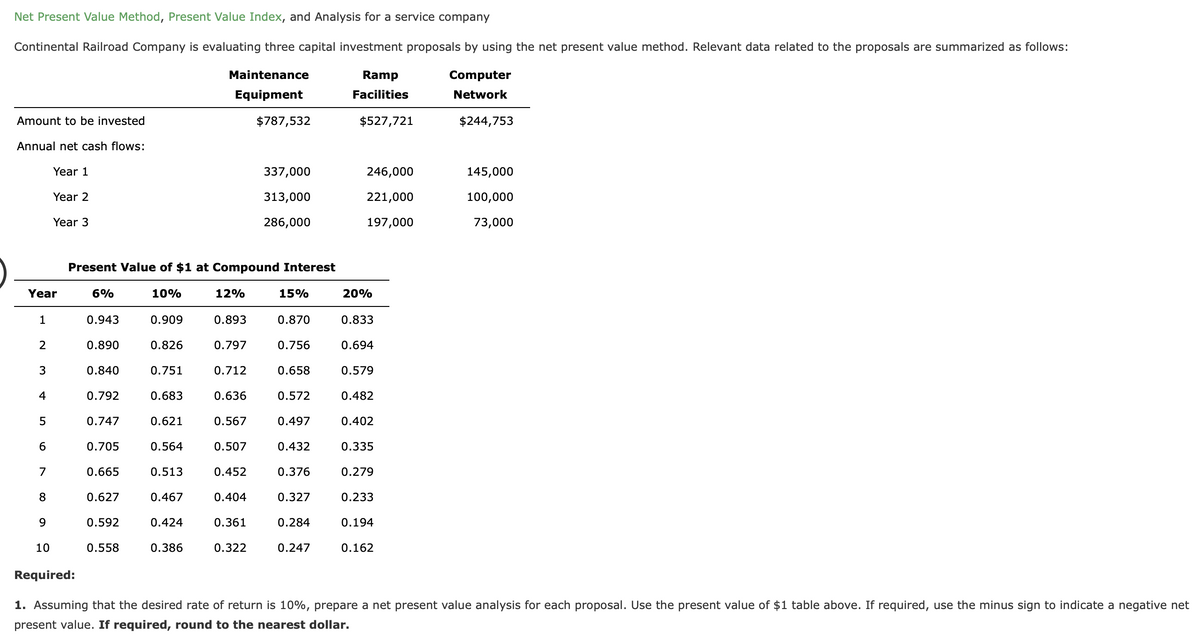

Transcribed Image Text:Net Present Value Method, Present Value Index, and Analysis for a service company
Continental Railroad Company is evaluating three capital investment proposals by using the net present value method. Relevant data related to the proposals are summarized as follows:
Maintenance
Ramp
Computer
Equipment
Facilities
Network
Amount to be invested
$787,532
$527,721
$244,753
Annual net cash flows:
Year 1
337,000
246,000
145,000
Year 2
313,000
221,000
100,000
Year 3
286,000
197,000
73,000
Present Value of $1 at Compound Interest
Year
6%
10%
12%
15%
20%
1
0.943
0.909
0.893
0.870
0.833
2
0.890
0.826
0.797
0.756
0.694
3
0.840
0.751
0.712
0.658
0.579
4
0.792
0.683
0.636
0.572
0.482
0.747
0.621
0.567
0.497
0.402
0.705
0.564
0.507
0.432
0.335
7
0.665
0.513
0.452
0.376
0.279
8.
0.627
0.467
0.404
0.327
0.233
0.592
0.424
0.361
0.284
0.194
10
0.558
0.386
0.322
0.247
0.162
Required:
1. Assuming that the desired rate of return is 10%, prepare a net present value analysis for each proposal. Use the present value of $1 table above. If required, use the minus sign to indicate a negative net
present value. If required, round to the nearest dollar.

Transcribed Image Text:Required:
1. Assuming that the desired rate of return is 10%, prepare a net present value analysis for each proposal. Use the present value of $1 table above. If required, use the minus sign to indicate a negative net
present value. If required, round to the nearest dollar.
Maintenance Equipment
Ramp Facilities
Computer Network
Total present value of net cash flow
Amount to be invested
Net present value
2. Determine a present value index for each proposal. If required, round your answers to two decimal places.
Present Value Index
Maintenance Equipment
Ramp Facilities
Computer Network
Expert Solution
arrow_forward
Step 1
Net Present Value is the difference of Present Value of Cash Inflow and outflow. Excess of Present Value of Cash Inflow to Cash Outflow indicates that investment in a particular field is viable. While negative figure indicates that cash inflow will not be able to cover the investment.
Present Value Index is the ratio of Present Value of Future Cash Flows to that of Initial Investment. A ratio below 1 is rejected while a ratio greater than 1 is accepted.

Step by stepSolved in 3 steps with 2 images

Knowledge Booster

Similar questions
- What is a capital investment and why do companies need to evaluate whether to make the investment or not?arrow_forwardWhich of the following can be used to place capital investment proposals involving different amounts of investment on a comparable basis for purposes of net present value analysis? a. future value index b. price-level index c. rate of investment index d. present value indexarrow_forwardWhat are the components of the weighted average cost of capital that a company should use for project valuation?arrow_forward
- What are the major methods used to prioritize capital projects?arrow_forwardThe selection and management of short term assets and liabilities by the firm is called: O Working capital management O Depreciation cost recovery Asset class cost analysis O Capital structure choice O Capital budgetingarrow_forwardCapital allocation process The capital allocation process involves the transfer of capital among different entities that include individuals, small businesses, banks, financial intermediaries, companies, mutual funds, and other market participants. In a developed market economy, capital flows freely between entities that want to supply capital to those who want it. This flow of capital can be classified in three ways. In the table below, identify the nature of capital transfer given in the scenario with its appropriate classification: Scenario Direct Transfers Indirect Transfers through Investment Banks Indirect Transfers through Financial Intermediaries Elliot invests $25,000 by purchasing 1,000 shares of an emerging markets mutual fund. This mutual fund invests in companies in Brazil, India, and China. He bought the mutual fund from the mutual fund company. Steve’s grandfather loans him $30,000 to start a small coffee shop in the East Village in…arrow_forward
- What are some risk factors when making decisions regarding capital projects? Provide details.arrow_forwardBriefly discuss capital asset price model from the standpoint of investors and managers.arrow_forwardThe process by which management plans, evaluates, and controls long-term investment decisions involving fixed assets is called capital investment analysis. True O Falsearrow_forward
arrow_back_ios
arrow_forward_ios
Recommended textbooks for you
- Essentials Of InvestmentsFinanceISBN:9781260013924Author:Bodie, Zvi, Kane, Alex, MARCUS, Alan J.Publisher:Mcgraw-hill Education,


 Foundations Of FinanceFinanceISBN:9780134897264Author:KEOWN, Arthur J., Martin, John D., PETTY, J. WilliamPublisher:Pearson,
 Fundamentals of Financial Management (MindTap Cou...FinanceISBN:9781337395250Author:Eugene F. Brigham, Joel F. HoustonPublisher:Cengage Learning
 Corporate Finance (The Mcgraw-hill/Irwin Series i...FinanceISBN:9780077861759Author:Stephen A. Ross Franco Modigliani Professor of Financial Economics Professor, Randolph W Westerfield Robert R. Dockson Deans Chair in Bus. Admin., Jeffrey Jaffe, Bradford D Jordan ProfessorPublisher:McGraw-Hill Education
Essentials Of Investments
Finance
ISBN:9781260013924
Author:Bodie, Zvi, Kane, Alex, MARCUS, Alan J.
Publisher:Mcgraw-hill Education,
Foundations Of Finance
Finance
ISBN:9780134897264
Author:KEOWN, Arthur J., Martin, John D., PETTY, J. William
Publisher:Pearson,
Fundamentals of Financial Management (MindTap Cou...
Finance
ISBN:9781337395250
Author:Eugene F. Brigham, Joel F. Houston
Publisher:Cengage Learning
Corporate Finance (The Mcgraw-hill/Irwin Series i...
Finance
ISBN:9780077861759
Author:Stephen A. Ross Franco Modigliani Professor of Financial Economics Professor, Randolph W Westerfield Robert R. Dockson Deans Chair in Bus. Admin., Jeffrey Jaffe, Bradford D Jordan Professor
Publisher:McGraw-Hill Education