
A First Course in Probability (10th Edition)
10th Edition
ISBN: 9780134753119
Author: Sheldon Ross
Publisher: PEARSON
expand_more
expand_more
format_list_bulleted
Related questions
Question
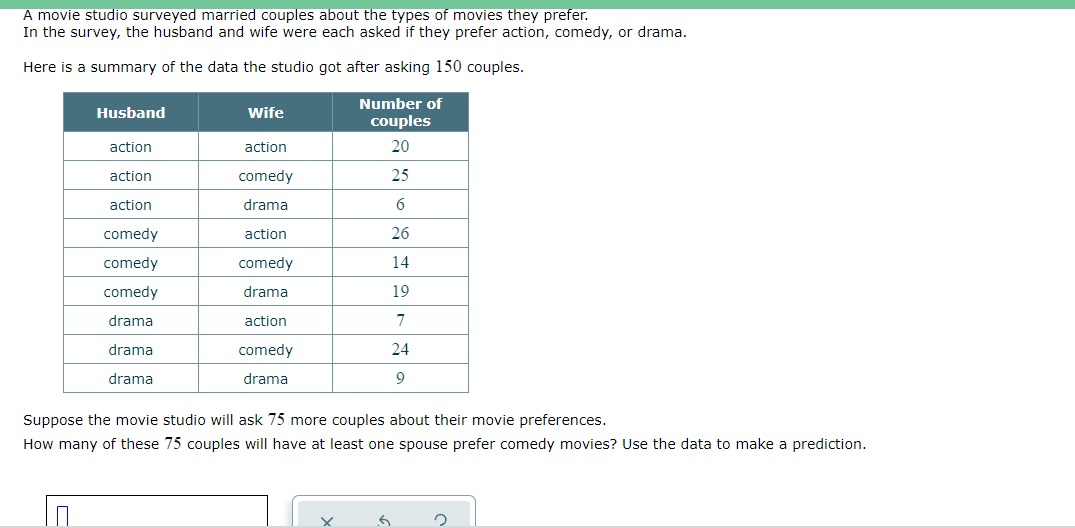

Transcribed Image Text:A movie studio surveyed married couples about the types of movies they prefer.
In the survey, the husband and wife were each asked if they prefer action, comedy, or drama.
Here is a summary of the data the studio got after asking 150 couples.
Number of
Husband
Wife
couples
action
action
20
action
comedy
25
action
drama
6
comedy
action
26
comedy
comedy
14
comedy
drama
19
drama
action
7
drama
comedy
24
drama
drama
9
Suppose the movie studio will ask 75 more couples about their movie preferences.
How many of these 75 couples will have at least one spouse prefer comedy movies? Use the data to make a prediction.
Expert Solution
This question has been solved!
Explore an expertly crafted, step-by-step solution for a thorough understanding of key concepts.

This is a popular solution

Trending nowThis is a popular solution!

Step by stepSolved in 3 steps with 1 images

Knowledge Booster

Similar questions
- After the premiere of the new comedy Bumblebee, moviegoers were asked in a quick poll whether they liked the movie. Out of 20 adults, 14 said they liked the movie, whereas out of 50 teenagers, 29 said they liked the movie. At the movie premiere, adult teenage movie goers liked the movie more because only % disliked the movie, whereas % of the ?adultteenagemoviegoers disliked the movie.arrow_forwardFavorite Skittles Flavor?A poll sampled 99 people, asking them their favorite skittle flavor by color (green, orange, purple, red, or yellow). A separate poll sampled 118 people, again asking them their favorite skittle flavor, but rather than by color they asked by the actual flavor (lime, orange, grape, strawberry, and lemon, respectively). The table below shows the results from both polls. Does the way people choose their favorite Skittles type, by color or flavor, appear to be related to which type is chosen? Green(Lime) Orange Purple(Grape) Red(Strawberry) Yellow(Lemon) Color 28 14 21 19 17 Flavor 19 22 26 37 14 Table 1 Skittles popularity (a) Give a table with the expected counts for each of the 10 cells.Round your answers to two decimal places. Green(Lime) Orange Purple(Grape) Red(Strawberry) Yellow(Lemon) Color Enter your answer in accordance to item (a) of the question statement Enter your answer in accordance to item…arrow_forwardIn a recent poll, 360 people were asked if they preferred cats or dogs. 49% said they preferred dogs and 51% of people said they preferred cats, with a margin of error of 2%. Which statement is true? A. In general, people prefer dogs. B. The number of people that prefer dogs is between 47% and 51%, and the number of people that prefer cats is between 49% and 53% C. In general, people prefer cats.arrow_forward
- When conducting research, you take a portion of a larger group of participants and do the research with that smaller group. The larger group is referred to as a population and the smaller group selected from the population is referred to as answerarrow_forwardA recent study examined the drinking behaviors of undergraduate college students (male and female freshmen). Each participant was asked how many alcoholic beverages they consumed during the past 7 days. The researchers wish to determine if there is a difference in the drinking habits of males and females in this age group. A recent study examined the drinking behaviors of undergraduate college students (male and female freshmen). Each participant was asked how many alcoholic beverages they consumed during the past 7 days. The researchers wish to determine if there is a difference in the drinking habits of male and females in this age group. Female Male 9 13 5 9 5 7 9 11 8 10 3 5 5 6 2 10 1 16 7 12 Which type of test will you run? What is the independent variable? What is the dependent variable?arrow_forwardCollege students were surveyed to check what they favored between basketball, football or baseball. The result of the survey is listed in the table below. Favorite sports Basketball Football Baseball Total Male 22 40 15 Female 45 12 16 Totalarrow_forward
- In a recent survey, 500 participants were asked about their favorite genre of movies. The results showed that 40% preferred action movies, 30% preferred comedy, 20% preferred drama, and the remaining participants preferred other genres. 1. How many participants preferred action movies? 2. How many participants preferred comedy movies? 3. How many participants preferred drama movies? 4. How many participants preferred other genres?arrow_forwardFind an article of your choice which uses proportions, and copy and paste the address of that article in this step. Identify at least one sample proportion within the article (you can list more than one if you like), and state what that sample proportion measures. For example, if you're told that the sample proportion of people in Renton who are taller than 5'11" is 80.7%, and you're also told that the sample size is 57, then you would state the proportion as 46/57 in your response for this part of the assignment. You will probably have to interpret what is being said in the article in order to be able to state specifically what the sample proportion represents. Also, you might not have x or n, you might only have the percentage or a decimal equivalent. Often, the size of the sample is stated somewhere in the article, and it's important to find that value. So, if n is given, please include it in this part of the assignment. If stated in the article, identify whether the sample is a…arrow_forwardIf four out of every seventeen students prefer to write with pens over pencils, what proportion of students prefer pens to pencils?arrow_forward
- Favorite Skittles Flavor?A poll sampled 75 people, asking them their favorite skittle flavor by color (green, orange, purple, red, or yellow). A separate poll sampled 98 people, again asking them their favorite skittle flavor, but rather than by color they asked by the actual flavor (lime, orange, grape, strawberry, and lemon, respectively). The table below shows the results from both polls. Does the way people choose their favorite Skittles type, by color or flavor, appear to be related to which type is chosen? Green(Lime) Orange Purple(Grape) Red(Strawberry) Yellow(Lemon) Color 20 10 17 15 13 Flavor 15 18 22 33 10 Table 1 Skittles popularity (a) Give a table with the expected counts for each of the 10 cells. Round your answers to two decimal places. b) How many degrees of freedom do we have for this test? c) Calculate the chi-square test statistic to 2 decimal places and the p-value to 4 decimal places.arrow_forwardDr. A. Ventura is interested in determining what kinds and how many pets people own in Bakersfield. He stands outside Petco and asks people what kind of pet they own. This is the result of his survey: dog=1; cat=2; bird=3; reptile=4; fish=5; other=6 1,1,2,2,2,1,1,3,2,3,1,1,1,2,2,4,4,2,2,1,1,1,5,4,3,4,1,1,1,2,2,6,1,1,2,2,1,2,1,2,6,3,4,5arrow_forwardA professor wanted to study the number of hours statistics students spend studyingstatistics each week. Out of 19 statistics sections at Santa Ana College, the professorsurveyed each student from 3 randomly selected sections. What is the largest group ofstudents the results of this study can represent?a. All Santa Ana College studentsb. All Santa Ana College students taking a math classc. All Santa Ana College students taking a statistics classd. Students in the three sections the professor surveyedarrow_forward
arrow_back_ios
SEE MORE QUESTIONS
arrow_forward_ios
Recommended textbooks for you
- A First Course in Probability (10th Edition)ProbabilityISBN:9780134753119Author:Sheldon RossPublisher:PEARSON

A First Course in Probability (10th Edition)
Probability
ISBN:9780134753119
Author:Sheldon Ross
Publisher:PEARSON