ENGR.ECONOMIC ANALYSIS
14th Edition
ISBN: 9780190931919
Author: NEWNAN
Publisher: Oxford University Press
expand_more
expand_more
format_list_bulleted
Question

Transcribed Image Text:**USE FIGURE #1:**
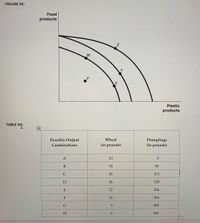
A movement from ___ is the result of a negative technological change in plastic production.
- ○ X to W
- ○ V to X
- ○ W to Z
- ○ Z to Y

Transcribed Image Text:**FIGURE #1:**
This diagram represents a Production Possibility Frontier (PPF) model, which illustrates the trade-offs between two goods: food products (vertical axis) and plastic products (horizontal axis).
- Points W, X, Y, and Z are on the PPF curve, representing efficient production levels where resources are fully utilized.
- Point V is inside the curve, indicating inefficiency, as some resources are underutilized.
- The further the curve is from the origin, the greater the potential production level, showcasing higher efficiency or resource quantity.
**TABLE #1:**
This table outlines possible output combinations between wheat and dumplings, displaying the trade-offs inherent in dedicating resources to one product over another.
| **Possible Output Combinations** | **Wheat (in pounds)** | **Dumplings (in pounds)** |
|----------------------------------|-----------------------|---------------------------|
| A | 63 | 0 |
| B | 54 | 90 |
| C | 45 | 171 |
| D | 36 | 243 |
| E | 27 | 306 |
| F | 18 | 360 |
| G | 9 | 405 |
| H | 0 | 441 |
This table complements the PPF by quantifying possible choices and opportunity costs in allocating resources to produce either wheat or dumplings.
Expert Solution
This question has been solved!
Explore an expertly crafted, step-by-step solution for a thorough understanding of key concepts.
This is a popular solution
Trending nowThis is a popular solution!
Step by stepSolved in 2 steps

Knowledge Booster
Similar questions
- ent-4.docx cetumentGrp Assignment 4. Saved to this Pd v Layout References Mailings A A™ | Aa- | Ap -I A. DA = = = |- |- B demand. daho Review if necessary. Paragraph View ENT Help For a particular video game, the company sells 160 (thousand) copies of the game when the (thousand) copies of the game. price of the game is $55. However, when they change the price to $45, the company sells 240 1 AaBhCcDdi AaBbCcDdi AalbC Đới 1 List Para... Normal 1 No Spac.... Styles a. As part of the process of finding the price elasticity of demand, what is the percent change in quantity using the midpoint method? Round your answer to 4 decimal places ECON 150: Microeconomics b. As part of the process of finding the price elasticity of demand, what is the percent change in price using the midpoint method? Round your answer to 4 decimal places if necessary. C. Using parts a and b, calculate the price elasticity of demand. Round your answer to 2 decimal places if necessary. Fourarrow_forward12LGjjfiV9KIUa7A14QC7gvvPrKFtW6ZwP60WrVE/edit AP 100% PRICE Dolars perp Answer Price ($) 10. Using the graph below, determine the equilibrium price and quantity of pens. 0000 5000- 3000 2000- Normal text Answer: RUBRIC Worksheet 2 Scenario 11. Using the graph below, determine the approximate equilibrium price and quantity of soap. Supety 3 QUANTITY ons of pens) Demand Curve Arial Supply Curve Cartoon P Quantity Supplied Price determination AND PRICE 11 Demand + B I UA Aarrow_forward
arrow_back_ios
arrow_forward_ios
Recommended textbooks for you

 Principles of Economics (12th Edition)EconomicsISBN:9780134078779Author:Karl E. Case, Ray C. Fair, Sharon E. OsterPublisher:PEARSON
 Engineering Economy (17th Edition)EconomicsISBN:9780134870069Author:William G. Sullivan, Elin M. Wicks, C. Patrick KoellingPublisher:PEARSON
 Principles of Economics (MindTap Course List)EconomicsISBN:9781305585126Author:N. Gregory MankiwPublisher:Cengage Learning
 Managerial Economics: A Problem Solving ApproachEconomicsISBN:9781337106665Author:Luke M. Froeb, Brian T. McCann, Michael R. Ward, Mike ShorPublisher:Cengage Learning
 Managerial Economics & Business Strategy (Mcgraw-...EconomicsISBN:9781259290619Author:Michael Baye, Jeff PrincePublisher:McGraw-Hill Education


Principles of Economics (12th Edition)
Economics
ISBN:9780134078779
Author:Karl E. Case, Ray C. Fair, Sharon E. Oster
Publisher:PEARSON

Engineering Economy (17th Edition)
Economics
ISBN:9780134870069
Author:William G. Sullivan, Elin M. Wicks, C. Patrick Koelling
Publisher:PEARSON

Principles of Economics (MindTap Course List)
Economics
ISBN:9781305585126
Author:N. Gregory Mankiw
Publisher:Cengage Learning

Managerial Economics: A Problem Solving Approach
Economics
ISBN:9781337106665
Author:Luke M. Froeb, Brian T. McCann, Michael R. Ward, Mike Shor
Publisher:Cengage Learning

Managerial Economics & Business Strategy (Mcgraw-...
Economics
ISBN:9781259290619
Author:Michael Baye, Jeff Prince
Publisher:McGraw-Hill Education