
MATLAB: An Introduction with Applications
6th Edition
ISBN: 9781119256830
Author: Amos Gilat
Publisher: John Wiley & Sons Inc
expand_more
expand_more
format_list_bulleted
Related questions
Question
please help me solve step 2 and 3. i already answered some question. topic os known standard deviation. thanks
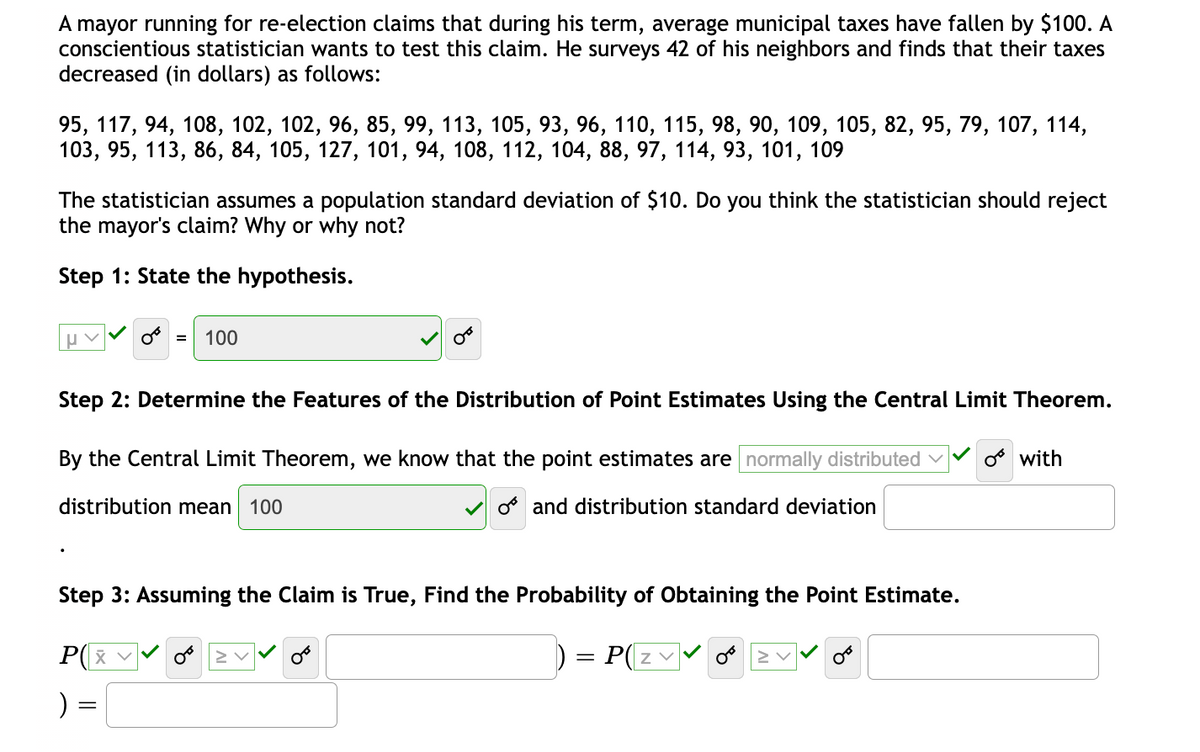

Transcribed Image Text:A mayor running for re-election claims that during his term, average municipal taxes have fallen by $100. A
conscientious statistician wants to test this claim. He surveys 42 of his neighbors and finds that their taxes
decreased (in dollars) as follows:
95, 117, 94, 108, 102, 102, 96, 85, 99, 113, 105, 93, 96, 110, 115, 98, 90, 109, 105, 82, 95, 79, 107, 114,
103, 95, 113, 86, 84, 105, 127, 101, 94, 108, 112, 104, 88, 97, 114, 93, 101, 109
The statistician assumes a population standard deviation of $10. Do you think the statistician should reject
the mayor's claim? Why or why not?
Step 1: State the hypothesis.
100
Step 2: Determine the Features of the Distribution of Point Estimates Using the Central Limit Theorem.
By the Central Limit Theorem, we know that the point estimates are normally distributed v
os with
distribution mean 100
os and distribution standard deviation
Step 3: Assuming the Claim is True, Find the Probability of Obtaining the Point Estimate.
P(X
P(zv
) =
Expert Solution
This question has been solved!
Explore an expertly crafted, step-by-step solution for a thorough understanding of key concepts.

This is a popular solution

Trending nowThis is a popular solution!

Step by stepSolved in 2 steps with 1 images

Knowledge Booster

Similar questions
- Jack's clothing sells on average, 25 shirts per week, sometimes a little more, sometimes a little less but typically a deviation of about 3. The cost per jacket is $65. Because Jack's is located in a sketchy part of town their insurance on inventory is 33% on all goods. The good news is free shipping to customers although UPS charges Jack's $8.50 for every delivery. It takes 2 weeks from the time jackets are ordered until they are received. Jack's supplier has said they only ship by pallet, and each pallet contains 75 jackets. If the reorder point is 50 what is the average flow time?arrow_forwardPlease solve a, b, and c. Note: Please explain and show steps for solutions especially for part c.arrow_forwardHi, please help me solve, thank you!arrow_forward
- Please please solve question 1 point a and b please explain. I have done already I need to compare and understand please explain.arrow_forwardZazil’s Instagram reels over the year have averaged around 70 likes per art reel with a standard deviation of 12. Since using trending music over her art reels, several of them have recently gone viral, averaging 120 likes with a standard deviation of 6. Zazil would like to know if adding trendy music over a reel increases her average likes. How do we use a Z-Test to test to calculate the data and determine if we reject or fail to reject the null hypothesis?arrow_forwardPlease answer the questions as soon as possible. Don’t need to explain everything step by step just solve the questions do the math only.arrow_forward
- Please help solve the problem in detail if possiblearrow_forwardPlease use the information from question 4 to only answer question 5.arrow_forwardfor data set of the pulse rates for a sample of adult females the lowest pulse rate is 36 bpm the mean of the list of pulse rate is X bar equals 72 bpm and their standard deviation is 12.9 bpm. what is the difference between the pulse rate of 36 bpm and the meatballs rid of the females how many celebrations is that the difference found in part a convert the pulse rate of 36 bpm to a z score if we consider pulse rates that convert to a Z score between -2 and 2 to be neither significantly lower significantly high is the pulse rate of 36bpm significantarrow_forward
arrow_back_ios
arrow_forward_ios
Recommended textbooks for you
- MATLAB: An Introduction with ApplicationsStatisticsISBN:9781119256830Author:Amos GilatPublisher:John Wiley & Sons Inc
 Probability and Statistics for Engineering and th...StatisticsISBN:9781305251809Author:Jay L. DevorePublisher:Cengage Learning
 Statistics for The Behavioral Sciences (MindTap C...StatisticsISBN:9781305504912Author:Frederick J Gravetter, Larry B. WallnauPublisher:Cengage Learning
  Elementary Statistics: Picturing the World (7th E...StatisticsISBN:9780134683416Author:Ron Larson, Betsy FarberPublisher:PEARSON
 The Basic Practice of StatisticsStatisticsISBN:9781319042578Author:David S. Moore, William I. Notz, Michael A. FlignerPublisher:W. H. Freeman
 Introduction to the Practice of StatisticsStatisticsISBN:9781319013387Author:David S. Moore, George P. McCabe, Bruce A. CraigPublisher:W. H. Freeman
MATLAB: An Introduction with Applications
Statistics
ISBN:9781119256830
Author:Amos Gilat
Publisher:John Wiley & Sons Inc
Probability and Statistics for Engineering and th...
Statistics
ISBN:9781305251809
Author:Jay L. Devore
Publisher:Cengage Learning
Statistics for The Behavioral Sciences (MindTap C...
Statistics
ISBN:9781305504912
Author:Frederick J Gravetter, Larry B. Wallnau
Publisher:Cengage Learning
Elementary Statistics: Picturing the World (7th E...
Statistics
ISBN:9780134683416
Author:Ron Larson, Betsy Farber
Publisher:PEARSON
The Basic Practice of Statistics
Statistics
ISBN:9781319042578
Author:David S. Moore, William I. Notz, Michael A. Fligner
Publisher:W. H. Freeman
Introduction to the Practice of Statistics
Statistics
ISBN:9781319013387
Author:David S. Moore, George P. McCabe, Bruce A. Craig
Publisher:W. H. Freeman