
MATLAB: An Introduction with Applications
6th Edition
ISBN: 9781119256830
Author: Amos Gilat
Publisher: John Wiley & Sons Inc
expand_more
expand_more
format_list_bulleted
Related questions
Concept explainers
Question
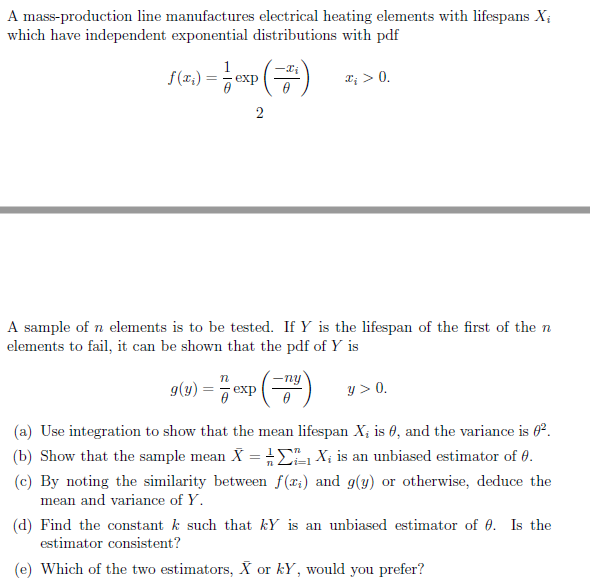

Transcribed Image Text:A mass-production line manufactures electrical heating elements with lifespans X;
which have independent exponential distributions with pdf
1
exp
T; > 0.
(2).
A sample of n elements is to be tested. If Y is the lifespan of the first of the n
elements to fail, it can be shown that the pdf of Y is
g(2) = , exp ()
y > 0.
(a) Use integration to show that the mean lifespan X; is 0, and the variance is 0.
(b) Show that the sample mean X = X; is an unbiased estimator of 0.
(c) By noting the similarity between f(x:) and g(y) or otherwise, deduce the
mean and variance of Y.
(d) Find the constant k such that kY is an unbiased estimator of 0. Is the
estimator consistent?
(e) Which of the two estimators, X or kY, would you prefer?
2.
Expert Solution
This question has been solved!
Explore an expertly crafted, step-by-step solution for a thorough understanding of key concepts.

Step by stepSolved in 2 steps with 4 images

Knowledge Booster


Learn more about
Need a deep-dive on the concept behind this application? Look no further. Learn more about this topic, statistics and related others by exploring similar questions and additional content below.Similar questions
- Suppose we ran logistic regression twice, once with 2 = 0, and once with 1 = 2. We .65 (102.09) and 0 = (00). Which value of 0 corresponds got the parameters 0 = (* to λ-0? Explain. 37.26 1.29arrow_forward4. Suppose that antibiotics are injected into a patient to treat a sinus infec- tion. The antibiotics circulate in the blood, slowly diffusing into the sinus cavity while simultaneously being filtered out of the blood by the liver. The following is a model for the concentration (in µg/mL) of the antibiotic in the sinus cavity as a function of time (in hours) since the injection. e-at – e-ßt C(t) В — а where a and B are constants with ß > a > 0. (a) occurs. (Your argument must use the first derivative test.) Using the first derivative test, find when the maximum concentration (b) (Your answer should be supported by a rigorous argument.) When does the rate of change of concentration begin to increase?arrow_forwardA regression function used to examine the factors affecting the chief executive officer salary in financial, manufacturing, utilities and transportation sector is given as below. Figures in parentheses are standard errors. Ln Y = 4.59 +0.257 log(X) + 0.158 D₁ +0.181D21 -0.283D31 se = (0.30) (0.032) (0.089) (0.085) (0.099) n = 209, R² = 0.357 Where Y = salary (in thousands) X₁ = annual sales D₁- D₂= D₂= (1, financial sector otherwise lo, manufacturing sector otherwise utililities sector otherwise Interpret the coefficient for D₂ Compute the approximate percentage difference in estimated salary between the utilities and transportation sector, holding annual sales fixed. Is the difference statistically significant at 1% level?arrow_forward
- Suppose the probability π(x)π(x) of reaching a target (such as getting a ball between goal posts) as a function of distance x (in metres) from the target is well-fitted by a logistic regression equation withlog(π(x)/[1−π(x)])=6.1−0.13xPlease answer below to 3 significant digits.Part a)For this prediction model, what is the probability of reaching the target from a distance of 49 metres.Part b)At what distance is the probability of reaching the target equal to 0.6?arrow_forwardWhich of the following is a valid pdf (accounting for rounding)? a.) f(x)= (x2+2)/10 x= 1,2 b.) f(x)= (x2-2)/7 x= 1,2,3 c.) f(x)= 3(x3/x) x= 0.2, 0.3655, 0.4 d.) f(x)= (x+1)/3 e.) x/50 x= 10, 20, 30arrow_forwardPart a Based only on the pessimistic estimates, is the new motel economically attractive? Please enter the PW used to reach your decision: $ Carry all interim calculations to 5 decimal places and then round your final answer to the nearest dollar. The tolerance is ±100.arrow_forward
- A nkcschools.instructure.com A population of 20 rabbits is introduced into an environment with a carrying capacity of 500 rabbits. The rabbit population increases by 10% every month. Make a logistic model that gives the number of rabbits N after t months. Use t as your variable and round r to three decimal places. Edit View Insert Format Tools Table 12pt v Paragraph v BIUA v ev T? v ...arrow_forwardplot the data points and find a logistic model of the form P(t) - c/1+a*e^-bt what is the value of c and what does c represent year population 1700 .6 1803 1 1928 2 1950 2.5 1960 3 1987 5 2019 7.7 2050 9.7 2100 10.9arrow_forwardA quality control team studies the relationshipbetween years of experience (x) for individualdesign employees and ability to complete acomplex project within a certain time frame (y),where Y = 1 if the project is successfullycompleted, and Y = 0 if not. We know: b0 = −1.68and b1 = 0.12.a) Write the estimated logit function.b) Estimate the odds that a design employeewith 10 years of experience completes thecomplex project.c) Find and interpret the estimated odds ratiofor this model.arrow_forward
- A study done in 1994, of Maryland's portion of Chesapeake Bay found the following information about stocks of market-sized oysters. The stock population was 218 million, the stock will not exceed 5089 million oysters, and the intrinsic exponential growth rate is 0.274 per year.arrow_forward4. You point your Geiger counter at a banana, waiting for it to click. You know that the time you have to wait is exponentially distributed with rate >= 1 Unfortunately, 10% of all Geiger counters have been sabotaged by Big Banana. A sabotaged Geiger counter, when pointed at a banana, will instead click after every 60 seconds to lull you into complacency. (a) Determine the CDF of the waiting time until your Geiger counter clicks (you do not know if your Geiger counter has been sabotaged). (b) If you have been waiting for 30 seconds and your Geiger counter still hasn't clicked yet, what is the probability that it has been sabotaged?arrow_forward
arrow_back_ios
arrow_forward_ios
Recommended textbooks for you
- MATLAB: An Introduction with ApplicationsStatisticsISBN:9781119256830Author:Amos GilatPublisher:John Wiley & Sons Inc
 Probability and Statistics for Engineering and th...StatisticsISBN:9781305251809Author:Jay L. DevorePublisher:Cengage Learning
 Statistics for The Behavioral Sciences (MindTap C...StatisticsISBN:9781305504912Author:Frederick J Gravetter, Larry B. WallnauPublisher:Cengage Learning
  Elementary Statistics: Picturing the World (7th E...StatisticsISBN:9780134683416Author:Ron Larson, Betsy FarberPublisher:PEARSON
 The Basic Practice of StatisticsStatisticsISBN:9781319042578Author:David S. Moore, William I. Notz, Michael A. FlignerPublisher:W. H. Freeman
 Introduction to the Practice of StatisticsStatisticsISBN:9781319013387Author:David S. Moore, George P. McCabe, Bruce A. CraigPublisher:W. H. Freeman
MATLAB: An Introduction with Applications
Statistics
ISBN:9781119256830
Author:Amos Gilat
Publisher:John Wiley & Sons Inc
Probability and Statistics for Engineering and th...
Statistics
ISBN:9781305251809
Author:Jay L. Devore
Publisher:Cengage Learning
Statistics for The Behavioral Sciences (MindTap C...
Statistics
ISBN:9781305504912
Author:Frederick J Gravetter, Larry B. Wallnau
Publisher:Cengage Learning
Elementary Statistics: Picturing the World (7th E...
Statistics
ISBN:9780134683416
Author:Ron Larson, Betsy Farber
Publisher:PEARSON
The Basic Practice of Statistics
Statistics
ISBN:9781319042578
Author:David S. Moore, William I. Notz, Michael A. Fligner
Publisher:W. H. Freeman
Introduction to the Practice of Statistics
Statistics
ISBN:9781319013387
Author:David S. Moore, George P. McCabe, Bruce A. Craig
Publisher:W. H. Freeman