MATLAB: An Introduction with Applications
6th Edition
ISBN: 9781119256830
Author: Amos Gilat
Publisher: John Wiley & Sons Inc
expand_more
expand_more
format_list_bulleted
Concept explainers
Question

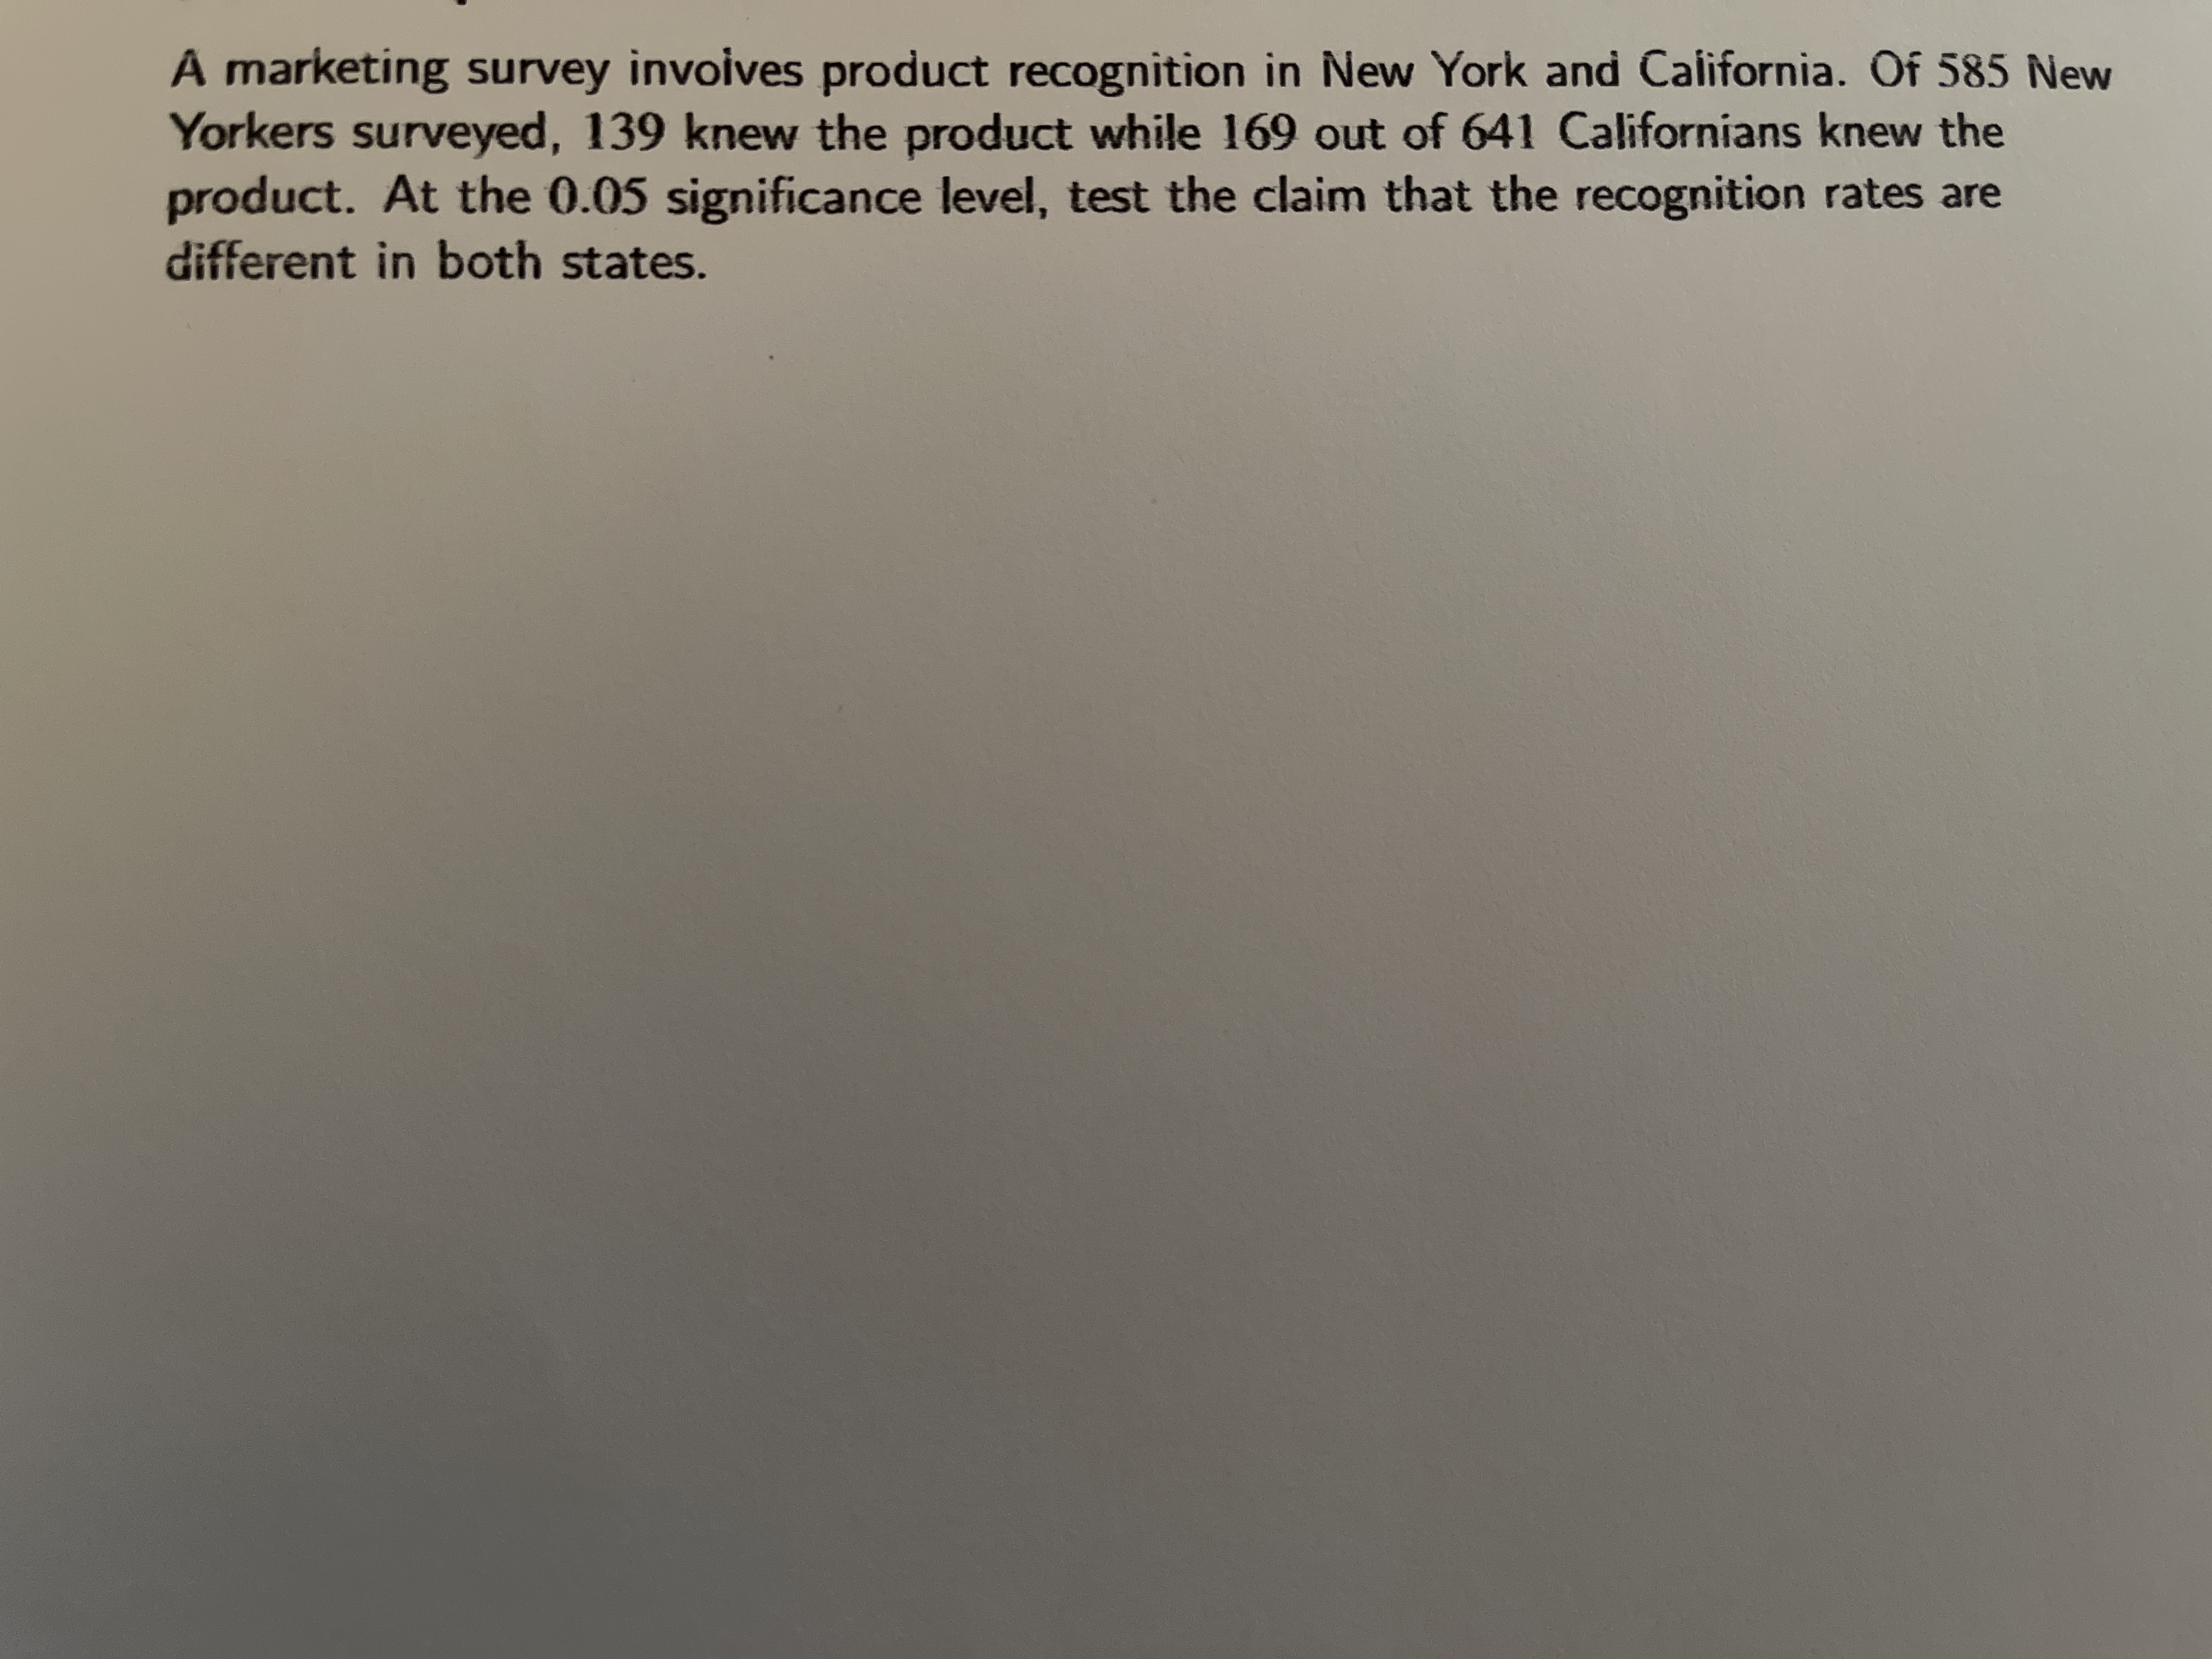
Transcribed Image Text:A marketing survey involves product recognition in New York and California. Of 585 New Yorkers surveyed, 139 knew the product, while 109 out of 641 Californians knew the product. At the 0.05 significance level, test the claim that the recognition rates are different in both states.
Expert Solution
This question has been solved!
Explore an expertly crafted, step-by-step solution for a thorough understanding of key concepts.
Step by stepSolved in 3 steps with 5 images

Knowledge Booster
Learn more about
Need a deep-dive on the concept behind this application? Look no further. Learn more about this topic, statistics and related others by exploring similar questions and additional content below.Similar questions
- A company that produces a particular brand of juice knows that about 30% of people select that brand if given a choice of all brands. To determine if a commercial would be an effective advertising tool, the company invites 100 people to view a 30-minute program that includes a commercial for the company’s juice. After the program, the participants are offered a choice of juice brands. In this trial, 36 of the 100 participants chose the company’s juice. When a significance test was performed to determine if the true proportion of people who watch the commercial and select the company’s juice exceeds 30%, the P-value was 0.0952. At the α = 0.05 significance level, what decision should the company make? A. Because the P-value of 0.0952 > α = 0.05, the company has evidence that the true proportion of those who would select the company’s juice is larger than 30%. B. Because the P-value of 0.0952 < 0.3, the company has evidence that the true proportion of those who would select the…arrow_forwardA study was conducted to determine the proportion of people who dream in black and white instead of color. Among 309 people over the age of 55, 68 dream in black and white, and among 295 people under the age of 25, 15 dream in black and white. Use a 0.05 significance level to test the claim that the proportion of people over 55 who dream in black and white is greater than the proportion for those under 25. identify the test statistic? identify the p value ? 98% confidenc interaval? reject or not to reject and why?arrow_forward40 people are randomly sent to walk one of four trails. The time (in minutes) they spend completing each trail is recorded in the table below. (a) Test to see if the times needed to complete a trail vary. Use a 0.05 significance level. (b) Test each pair (A/B, A/C, A/D, B/C, B/D, C/D) to see which trails have a statistically significant difference. Indicate your p-value for each comparison, and when the effect is statistically significant (use 0.05 as your significance level), declare which trail of the two takes more time to complete. Trail A - 30, 33, 41, 27, 36, 31, 37, 40, 29, 35 Trail B - 27, 33, 38, 41, 40, 38, 35, 44, 41, 39 Trail C - 25, 34, 41, 39, 32, 30, 36, 35, 27, 33 Trail D - 41, 39, 46, 37, 40, 42, 50, 42, 50, 33, 47, 43arrow_forward
- According to a survey conducted by the Association for Dressing and Sauces, 85% of American adults eat salad at least once a week. A nutritionist suspect that the percentage is higher that this. She conducts a survey of 200 American adults an finds that 171 of them eat salad at least once a week. Conduct the appropriate test that addresses the nutritionist's suspicions. Use the a = 0. 1 level of significance. What is the p-value? 0.85 0.855 0.1980 0.4215arrow_forwardIn a sample of 367 students, 132 said that they enjoy science. Using a significance level of a = 0.03, determine the test statistic and p-value when testing the claim that less than 35% of students enjoy science. Round the test statistic to two decimal places and the p-value to four decimal places. The test statistic is The p-value isarrow_forwardIn a random sample of 360 women, 63% favored stricter gun control laws. In a random sample of 220 men, 58% favored stricter gun control laws. Test the claim that the proportion of women favoring stricter gun control is higher than the proportion of men favoring stricter gun control. Use a significance level of 0.05.arrow_forward
arrow_back_ios
arrow_forward_ios
Recommended textbooks for you
 MATLAB: An Introduction with ApplicationsStatisticsISBN:9781119256830Author:Amos GilatPublisher:John Wiley & Sons Inc
 Probability and Statistics for Engineering and th...StatisticsISBN:9781305251809Author:Jay L. DevorePublisher:Cengage Learning
 Statistics for The Behavioral Sciences (MindTap C...StatisticsISBN:9781305504912Author:Frederick J Gravetter, Larry B. WallnauPublisher:Cengage Learning
 Elementary Statistics: Picturing the World (7th E...StatisticsISBN:9780134683416Author:Ron Larson, Betsy FarberPublisher:PEARSON
 The Basic Practice of StatisticsStatisticsISBN:9781319042578Author:David S. Moore, William I. Notz, Michael A. FlignerPublisher:W. H. Freeman
 Introduction to the Practice of StatisticsStatisticsISBN:9781319013387Author:David S. Moore, George P. McCabe, Bruce A. CraigPublisher:W. H. Freeman

MATLAB: An Introduction with Applications
Statistics
ISBN:9781119256830
Author:Amos Gilat
Publisher:John Wiley & Sons Inc

Probability and Statistics for Engineering and th...
Statistics
ISBN:9781305251809
Author:Jay L. Devore
Publisher:Cengage Learning

Statistics for The Behavioral Sciences (MindTap C...
Statistics
ISBN:9781305504912
Author:Frederick J Gravetter, Larry B. Wallnau
Publisher:Cengage Learning

Elementary Statistics: Picturing the World (7th E...
Statistics
ISBN:9780134683416
Author:Ron Larson, Betsy Farber
Publisher:PEARSON

The Basic Practice of Statistics
Statistics
ISBN:9781319042578
Author:David S. Moore, William I. Notz, Michael A. Fligner
Publisher:W. H. Freeman

Introduction to the Practice of Statistics
Statistics
ISBN:9781319013387
Author:David S. Moore, George P. McCabe, Bruce A. Craig
Publisher:W. H. Freeman