
MATLAB: An Introduction with Applications
6th Edition
ISBN: 9781119256830
Author: Amos Gilat
Publisher: John Wiley & Sons Inc
expand_more
expand_more
format_list_bulleted
Related questions
Question
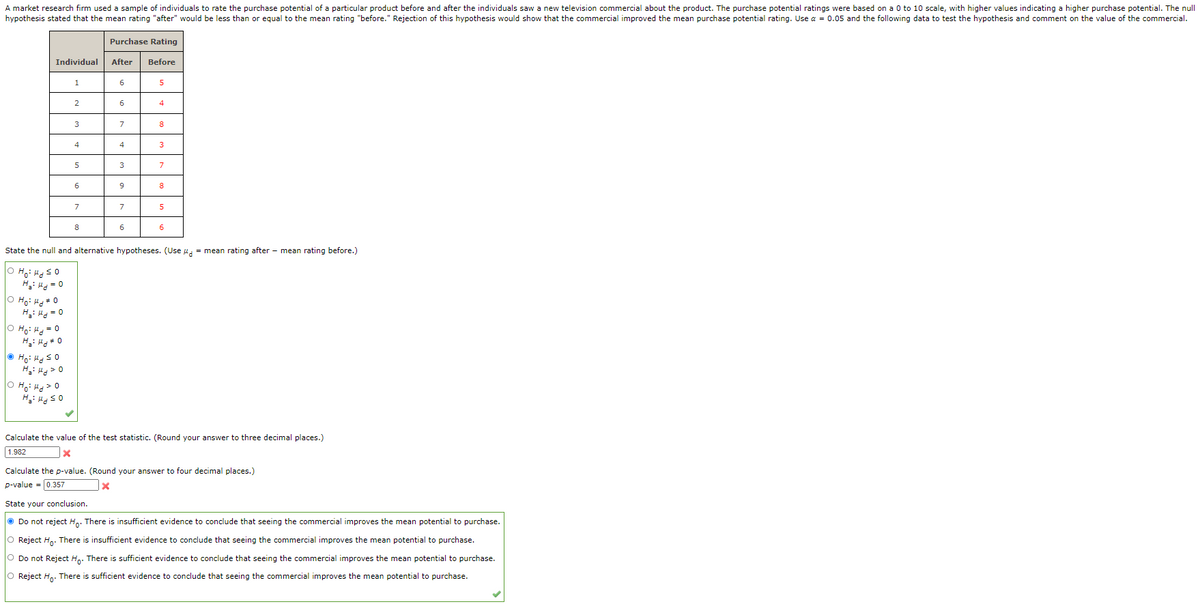

Transcribed Image Text:A market research firm used a sample of individuals to rate the purchase potential of a particular product before and after the individuals saw a new television commercial about the product. The purchase potential ratings were based on a 0 to 10 scale, with higher values indicating a higher purchase potential. The null
hypothesis stated that the mean rating "after" would be less than or equal to the mean rating "before." Rejection of this hypothesis would show that the commercial improved the mean purchase potential rating. Use a = 0.05 and the following data to test the hypothesis and comment on the value of the commercial.
Purchase Rating
Individual
After
Before
1
6
5
6
4
7
8
4
3
5
7
6
9.
8
7
7
5
8
6
State the null and alternative hypotheses. (Use u, = mean rating after - mean rating before.)
H: H = 0
H: = 0
O Ho: H = 0
H: Hg > 0
Calculate the value of the test statistic. (Round your answer to three decimal places.)
1.982
Calculate the p-value. (Round your answer to four decimal places.)
p-value = 0.357
State your conclusion.
O Do not reject Ho. There is insufficient evidence to conclude that seeing the commercial improves the mean potential to purchase.
O Reject Hn. There is insufficient evidence to conclude that seeing the commercial improves the mean potential to purchase.
O Do not Reject Hn. There is sufficient evidence to conclude that seeing the commercial improves the mean potential to purchase.
O Reject H,. There is sufficient evidence to conclude that seeing the commercial improves the mean potential to purchase.
Expert Solution
This question has been solved!
Explore an expertly crafted, step-by-step solution for a thorough understanding of key concepts.

This is a popular solution

Trending nowThis is a popular solution!

Step by stepSolved in 2 steps with 1 images

Knowledge Booster

Similar questions
- Read through this scenario and look at the data that was collected. State the null and all possible research hypotheses. Review the results below (I used SPSS) and answer the questions that follow. Scenario: A researcher wants to see if gender and / or income affects the total amount of help given to a stranger who is sitting on the side of a busy road with a sign asking for help. The independent variables are gender, income, and the interaction of gender and income. The dependent variable is total help. He wants to know if one or both factors – or the interaction of the two - affects the total amount of help offered. Because he is analyzing two independent variables (gender and income), he used a factorial ANOVA. His results show the main effect of each of the independent variables on the dependent variable (total help) and the interaction effect. The researcher is using a 95% confidence interval which means that he wants to be at least 95% sure that his independent variables…arrow_forwardThe Economist collects data each year on the price of a Big Mac in various countries around the world. A sample of McDonald's restaurants in Europe in July 2016 resulted in the following Big Mac prices (after conversion to U.S. dollars). 4.47 3.14 2.44 3.95 4.37 4.52 4.20 3.69 4.65 3.80 3.38 3.83 The mean price of a Big Mac in the U.S. in July 2016 was $5.04. For purposes of this exercise, you can assume it is reasonable to regard the sample as representative of European McDonald's restaurants. Does the sample provide convincing evidence that the mean July 2016 price of a Big Mac in Europe is less than the reported U.S. price? Test the relevant hypotheses using α = 0.05. (Hint: See Example 12.12.) State the appropriate null and alternative hypotheses. H0: μ < 5.04 Ha: μ > 5.04 H0: μ = 5.04 Ha: μ < 5.04 H0: μ = 5.04 Ha: μ > 5.04 H0: μ > 5.04 Ha: μ < 5.04 H0: μ = 5.04 Ha: μ ≠ 5.04 Find the test statistic and P-value. (Use a table or technology.…arrow_forwardWhat is the summary of the overall model of the data shown in question 1? Is it one that you would trust from a statistical standpoint? specifically why ?arrow_forward
- Houston North Hospital is trying to improve its image by providing a positive experience for its patients and their relatives. Part of the "image" program involves providing tasty, inviting patient meals that are also healthful. A questionnaire accompanies each meal served, asking the patient, among other things, whether he or she is satisfied or unsatisfied with the meal. A 50-patient sample of the survey results over the past 7 days yielded the following data: ITT No. of Unsatisfied Day Patients Sample Size 1 22 50 2 20 50 3 10 50 4 15 50 10 50 6 24 50 7 19 50 The control limits to include 99.73% of the random variation in meal satisfaction are: UCL, = (enter your response as a number between 0 and 1, rounded to three decimal places). LCL, =|(enter your response as a number between 0 and 1, rounded to three decimal places). Based on the developed control limits, the number of unsatisfied patients has been Enter your answer in each of the answer boxes.arrow_forwardThe trend of thinner Miss America winners has generated charges that the contest encourages unhealthy diet habits among young women. Listed below are body mass indexes (BMI) for recent Miss America winners. Use a .05 significance level to test the claim that recent Miss America winners are from a population with a mean BMI less than 20.16, which was the BMI for winners from the 1920s and 1930s. [ 18.5 , 20.3 , 19.6 , 20.2 , 18.8 , 17.9 , 19.1 , 18.8 , 17.6 , 16.8 ]arrow_forwardThe Economist collects data each year on the price of a Big Mac in various countries around the world. The price of a Big Mac for a sample of McDonalds restaurants in Europe in May 2009 resulted in the following Big Mac prices (after conversion to U.S. dollars):3.80 5.89 4.92 3.88 2.65 5.57 6.39 3.24The mean price of a Big Mac in the U.S. in May 2009 was $3.57. For purposes of this exercise, assume it is reasonable to regard the sample as representative of European McDonalds restaurants. Does the sample provide convincing evidence that the mean May 2009 price of a Big Mac in Europe is greater than the reported U.S. price? Test the relevant hypotheses using a = .05. Assume a normal distribution of the data. x = Ho: μ = Ha: Select an answer α= P-value = |: S= Based on the above we choose Question Help: Post to foru Submit Question (Put in the correct symbol and value) ✓ Select an answer Reject the null hypothesis Fail to reject the null hypothesisarrow_forward
- The manager of the Danvers-Hilton Resort Hotel stated that the mean guest bill for a weekend is $600 (the population). A member of the hotel's accounting staff noticed that the total charges for guest bills have been increasing in recent months. The accountant will use a sample of future weekend guest bills to test the manager's claim that the sample of bills are greater than the population mean of $600. Which hypothesis test should be used to test the manager's claim? Group of answer choices a) Three-tailed test b) None of the answers c) One-tailed test d) Two-tailed testarrow_forwardA group of disabled women ages 65 and older were followed for several years. It was found that those who had a vitamin B12 deficiency were twice as likely to suffer from severe depressions than those who did not.a. Describe the type of study being performed.b. Describe the explanatory variable(s) and response variable(s).arrow_forwardFor the folllwing two questions state the response variable and the explanatory variable 1.Is there a relationship between the final rating given by the customer and the number of exchanges during the conversation? If so, which of the exchange categories have significantly different mean ratings? 2. It is thought that having a relatively consistent length of message in any given conversation indicates a pattern of helpful, well-balanced communication. In fact, some new research suggests that to ensure a productive conversation the maximum message length should be no more than 8 words greater than the minimum message length in any conversation. Test whether the conversations in the sample meet the criteria suggested by this research study.arrow_forward
- The increasing popularity of online shopping has many consumers using Internet access at work to browse and shop online. In fact, the Monday after Thanksgiving has been nicknamed “Cyber Monday” because of the large increase in online purchases that occurs on that day. Data from a large-scale survey by a market research firm (Detroit Free Press, November 26, 2005) was used to compute estimates of the percent of men and women who shop online while at work. The resulting estimates probably won’t make most employers happy—42% of the men and 32% of the women in the sample were shopping online at work! Are the estimates given computed using data from a sample or for the entire population?arrow_forwardA graduate student is interested in how viewing different types of scenes affects working memory. For his study, he selects a random sample of 36 adults. The subjects complete a series of working memory tests before and after walking in an urban setting. Before the walk, the mean score on the test of working memory was 9.1. After the walk, the mean score was 1.4 higher. The graduate student has no presupposed assumptions about how viewing different types of scenes affects working memory, so he formulates the null and alternative hypotheses as: H00 : μDD = 0 H11 : μDD ≠ 0 Assume that the data satisfy all of the required assumptions for a repeated-measures t test. The graduate student calculates the following statistics for his hypothesis test: Mean difference (MDD) 1.4 Estimated population standard deviation of the differences (s) 1.6 Estimated standard error of the mean differences (sMDMD) 0.2667 Degrees of freedom (df) 35 The t statistic 5.25 The critical values of t…arrow_forwardKris works for the MESA Air Pollution Study at UW, and studies the correlation be- tween air pollution and the disease atherosclerosis. Nationally, 40% of adults suffer from atherosclerosis. Kris suspects that the proportion of people with atherosclerosis in high- pollution areas is higher. In a random sample of 600 residents of high-pollution areas, he finds that 270 (45%) subjects have atherosclerosis. At the 1% level (α = .01), is this good evidence that people in high-pollution areas are more likely to have atherosclerosis? (a) Which of the following is the Ha ? (research claim or alternate) A. Ha : p ≥ 0.40 B. Ha : pb ≥ 0.40 C. Ha : p > 0.40 D. Ha : p > b 0.40 E. Ha : p > b 0.45 F. Ha : p > 0.45 G. Ha : pb ≥ 0.45 H. Ha : p ≥ 0.45 I. None of these Hint: First read the problem and using my notes (or Hawkes) for 9.1, set up H0 and Ha . Then pick the right Ha from the above list. Dont try to guess the answer from the above list. (b) Which of the…arrow_forward
arrow_back_ios
SEE MORE QUESTIONS
arrow_forward_ios
Recommended textbooks for you
- MATLAB: An Introduction with ApplicationsStatisticsISBN:9781119256830Author:Amos GilatPublisher:John Wiley & Sons Inc
 Probability and Statistics for Engineering and th...StatisticsISBN:9781305251809Author:Jay L. DevorePublisher:Cengage Learning
 Statistics for The Behavioral Sciences (MindTap C...StatisticsISBN:9781305504912Author:Frederick J Gravetter, Larry B. WallnauPublisher:Cengage Learning
  Elementary Statistics: Picturing the World (7th E...StatisticsISBN:9780134683416Author:Ron Larson, Betsy FarberPublisher:PEARSON
 The Basic Practice of StatisticsStatisticsISBN:9781319042578Author:David S. Moore, William I. Notz, Michael A. FlignerPublisher:W. H. Freeman
 Introduction to the Practice of StatisticsStatisticsISBN:9781319013387Author:David S. Moore, George P. McCabe, Bruce A. CraigPublisher:W. H. Freeman
MATLAB: An Introduction with Applications
Statistics
ISBN:9781119256830
Author:Amos Gilat
Publisher:John Wiley & Sons Inc
Probability and Statistics for Engineering and th...
Statistics
ISBN:9781305251809
Author:Jay L. Devore
Publisher:Cengage Learning
Statistics for The Behavioral Sciences (MindTap C...
Statistics
ISBN:9781305504912
Author:Frederick J Gravetter, Larry B. Wallnau
Publisher:Cengage Learning
Elementary Statistics: Picturing the World (7th E...
Statistics
ISBN:9780134683416
Author:Ron Larson, Betsy Farber
Publisher:PEARSON
The Basic Practice of Statistics
Statistics
ISBN:9781319042578
Author:David S. Moore, William I. Notz, Michael A. Fligner
Publisher:W. H. Freeman
Introduction to the Practice of Statistics
Statistics
ISBN:9781319013387
Author:David S. Moore, George P. McCabe, Bruce A. Craig
Publisher:W. H. Freeman