
MATLAB: An Introduction with Applications
6th Edition
ISBN: 9781119256830
Author: Amos Gilat
Publisher: John Wiley & Sons Inc
expand_more
expand_more
format_list_bulleted
Related questions
Question
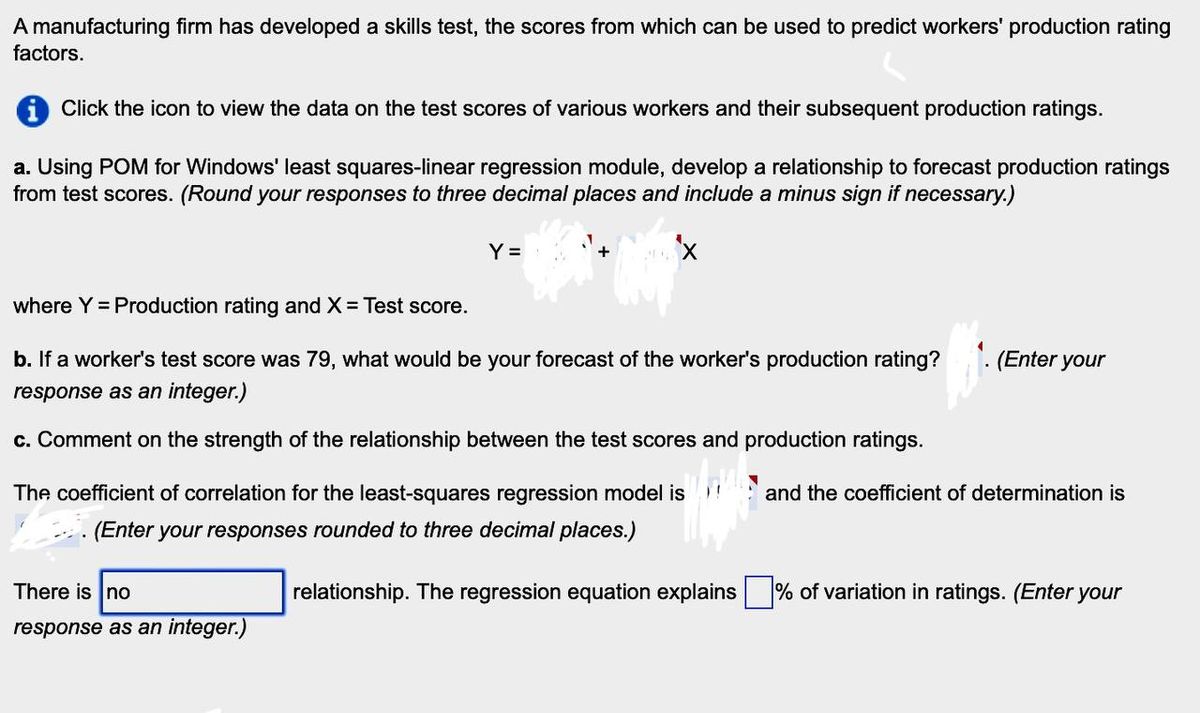

Transcribed Image Text:A manufacturing firm has developed a skills test, the scores from which can be used to predict workers' production rating
factors.
1 Click the icon to view the data on the test scores of various workers and their subsequent production ratings.
a. Using POM for Windows' least squares-linear regression module, develop a relationship to forecast production ratings
from test scores. (Round your responses to three decimal places and include a minus sign if necessary.)
Y =
where Y = Production rating and X = Test score.
b. If a worker's test score was 79, what would be your forecast of the worker's production rating?
response as an integer.)
c. Comment on the strength of the relationship between the test scores and production ratings.
The coefficient of correlation for the least-squares regression model is
(Enter your responses rounded to three decimal places.)
There is no
(Enter your
and the coefficient of determination is
relationship. The regression equation explains
% of variation in ratings. (Enter your
response as an integer.)
Expert Solution
This question has been solved!
Explore an expertly crafted, step-by-step solution for a thorough understanding of key concepts.

Step by stepSolved in 2 steps

Knowledge Booster

Similar questions
- Show your work please.arrow_forwardThe data show the chest size and weight of several bears. Find the regression equation, letting chest size be the independent (x) variable. Then find the best predicted weight of a bear with a chest size of 40 inches. Is the result close to the actual weight of 352 pounds? Use a significance level of 0.05. Chest size (inches) *Weight (pounds) 44 54 328 528 41 55 39 51 418 580 296 503 Click the icon to view the critical values of the Pearson correlation coefficient r. - What is the regression equation? x (Round to one decimal place as needed.)arrow_forwardThe data show the chest size and weight of several bears. Find the regression equation, letting chest size be the independent (x) variable. Then find the best predicted weight of a bear with a chest size of 57 inches. Is the result close to the actual weight of 476 pounds? Use a significance level of 0.05. 44 Chest size (inches) Weight (pounds) 58 48 51 58 60 425 266 347 453 282 408 Click the icon to view the critical values of the Pearson correlation coefficient r. ..... What is the regression equation? y=+x (Round to one decimal place as needed.) Activate Windows View an example Get more help- Help me solve this O Type here to search hp delete insert prt sc f12 f1o fg 1 f7 f6 f5 f3 米 IOI f1 esc hom backspace 6. L. 4 U E R tab F G J. A caps lock pause 00 9, %24 3. %23arrow_forward
- The value of a sports franchise is directly related to the amount of revenue that a franchise can generate. The following data represents the value in 2014 (in $millions) and the annual revenue (in $millions) for the 30 Major League Baseball franchises. Suppose you want to develop a simple linear regression model to predict franchise value based on annual revenue generated. Team Revenue Value Baltimore 245 1000 Boston 370 2100 Chicago White Sox 227 975 Cleveland 207 825 Detroit 254 1125 Houston 175 800 Kansas City 231 700 Los Angeles Angels 304 1300 Minnesota 223 895 New York Yankees 508 3200 Oakland 202 725 Seattle 250 1100 Tampa Bay 188 625 Texas 266 1220 Toronto 226 870 Arizona 211 840 Atlanta 267 1150 Chicago Cubs 302 1800 Cincinnati 227 885 Colorado…arrow_forwardFind the equation of the regression line for the given data. Then construct a scatter plot of the data and draw the regression line. (Each pair of variables has a significant correlation.) Then use the regression equation to predict the value of y for each of the given x-values, if meaningful. The caloric content and the sodium content (in milligrams) for 6 beef hot dogs are shown in the table below. Calories, x Sodium, y 130 380 80 270 (a) x= 150 calories (c) x-120 calories 190 160 415 180 465 130 350 (b) X3D90 calories (d) x= 60 calories 540 (a) Predict the value of y for x= 150. Choose the correct answer below. O A. 212.451 B. 347.151 C. 414.501 O D. not meaningful (b) Predict the value of y for x= 90. Choose the correct answer below. O A. 212.451 O B. 347.151 es OC. 279.801arrow_forwardThe data show the chest size and weight of several bears. Find the regression equation, letting chest size be the independent (x) variable. Then find the best predicted weight of a bear with a chest size of 63 inches. Is the result close to the actual weight of 532 pounds? Use a significance level of 0.05. Chest size (inches) Weight (pounds) 58 414 50 312 65 59 59 499 48 g 450 456 260 Click the icon to view the critical values of the Pearson correlation coefficient r. What is the regression equation? y = x (Round to one decimal place as needed.) - Critical Values of the Pearson Correlation Coefficient r Critical Values of the Pearson Correlation Coefficient r α = 0.05 α=0.01 NOTE: To test Ho: p=0 4 0.950 0.990 against H₁: p0, reject Ho 5 0.878 0.959 if the absolute value of ris 6 0.811 0.917 7 0.754 0.875 greater than the critical value in the table. 8 0.707 0.834 9 0.666 0.798 10 0.632 0.765 11 0.602 0.735 12 0.576 0.708 13 0.553 0.684 14 0.532 0.661 15 0.514 0.641 16 0.497 0.623 17…arrow_forward
- The table below shows the average weekly wages (in dollars) for state government employees and federal government employees for 10 years. Construct and interpret a 95% prediction interval for the average weekly wages of federal government employees when the average weekly wages of state government employees is $895. The equation of the regression line is y = 1.454x- 36.984. Wages (state), x Wages (federal), y 712 778 789 801 843 878 927 937 939 958 1,014 1,054 1,116 1,146 1,191 1,248 1,270 1,302 1,335 1,401 Construct and interpret a 95% prediction interval for the average weekly wages of federal government employees when the average weekly wages of state government employees is $895. Select the correct choice below and fill in the answer boxes to complete your choice. (Round to the nearest cent as needed.) O A. We can be 95% confident that when the average weekly wages of state government employees is $895, the average weekly wages of federal government employees will be between $ and…arrow_forwardThe correct answer is option C but I do not know how to find the number that go inside it.arrow_forwardCritical values of the pearson correlation coefficient r Critical Values of the Pearson Correlation Coefficient r NOTE: To test Ho: p= 0 against H,: p 0, reject H, if the absolute value of r is greater than the critical value in the table. a = 0.05 a = 0.01 4 0.950 0.990 0.878 0.959 0.811 0.917 7 0.754 0.875 8 0.707 0.834 9. 0.666 0.798 10 0.632 0.765 11 0.602 0.735 12 0.576 0.708 13 0.553 0.684 14 0.532 0.661 15 0.514 0.641 16 0.497 0.623 17 0.482 0.606 18 0.468 0.590 19 0.456 0.575 Print Done Cloar all Checkarrow_forward
arrow_back_ios
arrow_forward_ios
Recommended textbooks for you
- MATLAB: An Introduction with ApplicationsStatisticsISBN:9781119256830Author:Amos GilatPublisher:John Wiley & Sons Inc
 Probability and Statistics for Engineering and th...StatisticsISBN:9781305251809Author:Jay L. DevorePublisher:Cengage Learning
 Statistics for The Behavioral Sciences (MindTap C...StatisticsISBN:9781305504912Author:Frederick J Gravetter, Larry B. WallnauPublisher:Cengage Learning
  Elementary Statistics: Picturing the World (7th E...StatisticsISBN:9780134683416Author:Ron Larson, Betsy FarberPublisher:PEARSON
 The Basic Practice of StatisticsStatisticsISBN:9781319042578Author:David S. Moore, William I. Notz, Michael A. FlignerPublisher:W. H. Freeman
 Introduction to the Practice of StatisticsStatisticsISBN:9781319013387Author:David S. Moore, George P. McCabe, Bruce A. CraigPublisher:W. H. Freeman
MATLAB: An Introduction with Applications
Statistics
ISBN:9781119256830
Author:Amos Gilat
Publisher:John Wiley & Sons Inc
Probability and Statistics for Engineering and th...
Statistics
ISBN:9781305251809
Author:Jay L. Devore
Publisher:Cengage Learning
Statistics for The Behavioral Sciences (MindTap C...
Statistics
ISBN:9781305504912
Author:Frederick J Gravetter, Larry B. Wallnau
Publisher:Cengage Learning
Elementary Statistics: Picturing the World (7th E...
Statistics
ISBN:9780134683416
Author:Ron Larson, Betsy Farber
Publisher:PEARSON
The Basic Practice of Statistics
Statistics
ISBN:9781319042578
Author:David S. Moore, William I. Notz, Michael A. Fligner
Publisher:W. H. Freeman
Introduction to the Practice of Statistics
Statistics
ISBN:9781319013387
Author:David S. Moore, George P. McCabe, Bruce A. Craig
Publisher:W. H. Freeman