MATLAB: An Introduction with Applications
6th Edition
ISBN: 9781119256830
Author: Amos Gilat
Publisher: John Wiley & Sons Inc
expand_more
expand_more
format_list_bulleted
Question
Rush

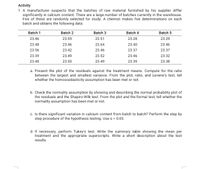
Transcribed Image Text:Activity
1. A manufacturer suspects that the batches of raw material furnished by his supplier differ
significantly in calcium content. There are a large number of batches currently in the warehouse.
Five of these are randomly selected for study. A chemist makes five determinations on each
batch and obtains the following data:
Batch 1
Batch 2
Batch 3
Batch 4
Batch 5
23.46
23.59
23.51
23.28
23.29
23.48
23.46
23.64
23.40
23.46
23.56
23.42
23.46
23.37
23.37
23.39
23.49
23.52
23.46
23.32
23.40
23.50
23.49
23.39
23.38
a. Present the plot of the residuals against the treatment means. Compute for the ratio
between the largest and smallest variance. From the plot, ratio, and Levene's test, tell
whether the homoscedasticity assumption has been met or not.
b. Check the normality assumption by showing and describing the normal probability plot of
the residuals and the Shapiro-Wilk test. From the plot and the formal test, tell whether the
normality assumption has been met or not.
c. Is there significant variation in calcium content from batch to batch? Perform the step by
step procedure of the hypothesis testing. Use a = 0.05.
d. If necessary, perform Tukey's test. Write the summary table showing the mean per
treatment and the appropriate superscripts. Write a short description about the test
results.
Expert Solution
This question has been solved!
Explore an expertly crafted, step-by-step solution for a thorough understanding of key concepts.
This is a popular solution
Trending nowThis is a popular solution!
Step by stepSolved in 4 steps with 2 images

Knowledge Booster
Similar questions
Recommended textbooks for you
 MATLAB: An Introduction with ApplicationsStatisticsISBN:9781119256830Author:Amos GilatPublisher:John Wiley & Sons Inc
 Probability and Statistics for Engineering and th...StatisticsISBN:9781305251809Author:Jay L. DevorePublisher:Cengage Learning
 Statistics for The Behavioral Sciences (MindTap C...StatisticsISBN:9781305504912Author:Frederick J Gravetter, Larry B. WallnauPublisher:Cengage Learning
 Elementary Statistics: Picturing the World (7th E...StatisticsISBN:9780134683416Author:Ron Larson, Betsy FarberPublisher:PEARSON
 The Basic Practice of StatisticsStatisticsISBN:9781319042578Author:David S. Moore, William I. Notz, Michael A. FlignerPublisher:W. H. Freeman
 Introduction to the Practice of StatisticsStatisticsISBN:9781319013387Author:David S. Moore, George P. McCabe, Bruce A. CraigPublisher:W. H. Freeman

MATLAB: An Introduction with Applications
Statistics
ISBN:9781119256830
Author:Amos Gilat
Publisher:John Wiley & Sons Inc

Probability and Statistics for Engineering and th...
Statistics
ISBN:9781305251809
Author:Jay L. Devore
Publisher:Cengage Learning

Statistics for The Behavioral Sciences (MindTap C...
Statistics
ISBN:9781305504912
Author:Frederick J Gravetter, Larry B. Wallnau
Publisher:Cengage Learning

Elementary Statistics: Picturing the World (7th E...
Statistics
ISBN:9780134683416
Author:Ron Larson, Betsy Farber
Publisher:PEARSON

The Basic Practice of Statistics
Statistics
ISBN:9781319042578
Author:David S. Moore, William I. Notz, Michael A. Fligner
Publisher:W. H. Freeman

Introduction to the Practice of Statistics
Statistics
ISBN:9781319013387
Author:David S. Moore, George P. McCabe, Bruce A. Craig
Publisher:W. H. Freeman