
MATLAB: An Introduction with Applications
6th Edition
ISBN: 9781119256830
Author: Amos Gilat
Publisher: John Wiley & Sons Inc
expand_more
expand_more
format_list_bulleted
Related questions
Question

Transcribed Image Text:12.1.11-T
Question Help ▼
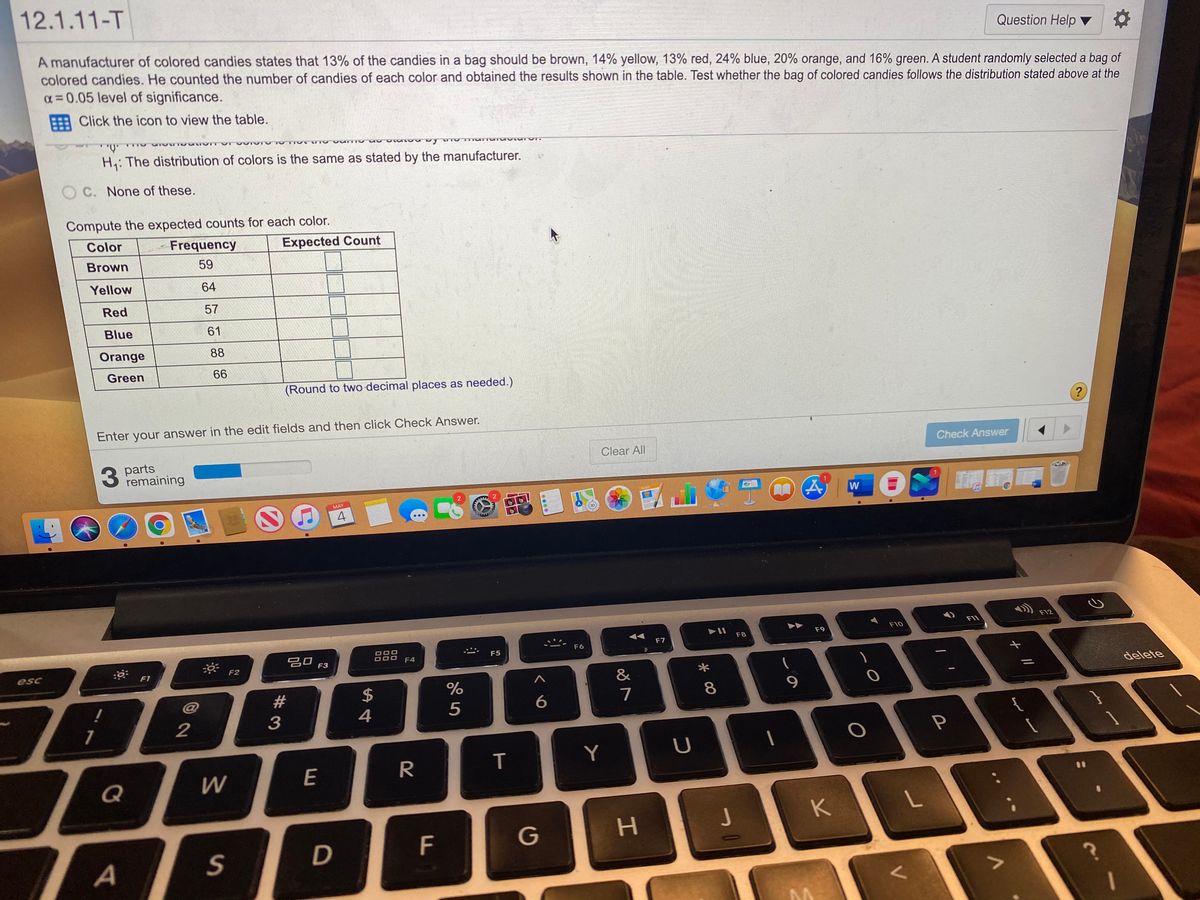
A manufacturer of colored candies states that 13% of the candies in a bag should be brown, 14% yellow, 13% red, 24% blue, 20% orange, and 16% green. A student randomly selected a bag of
colored candies. He counted the number of candies of each color and obtained the results shown in the table. Test whether the bag of colored candies follows the distribution stated above at the
a= 0.05 level of significance.
H Click the icon to view the table.
H: The distribution of colors is the same as stated by the manufacturer.
C. None of these.
Compute the expected counts for each color.
Color
Frequency
Expected Count
Brown
59
Yellow
64
Red
57
Blue
61
Orange
88
Green
66
(Round to two decimal places as needed.)
Enter your answer in the edit fields and then click Check Answer.
parts
remaining
Clear All
Check Answer
W
MAY
4
F11
F12
F9
F10
F8
ロロ口
DOO
F4
F7
F6
吕口
F5
F3
esc
F2
F1
&
delete
$
7
8
9.
4
5
2
P
Y
U
E
R
Q
J
K
F
G
D.
#3
Expert Solution
This question has been solved!
Explore an expertly crafted, step-by-step solution for a thorough understanding of key concepts.

This is a popular solution

Trending nowThis is a popular solution!

Step by stepSolved in 2 steps with 2 images

Knowledge Booster


Learn more about
Need a deep-dive on the concept behind this application? Look no further. Learn more about this topic, statistics and related others by exploring similar questions and additional content below.Similar questions
- A company is started by four friends. The company was Erica’s idea, so she wants to fill 70% of the orders. Jen, Heather, and Tonya each agree to fill 10% of the orders. After a successful first year, Erica wants to determine if the distribution of the number of orders filled is adhering to the agreed-upon percentages. To do so, she selects a random sample of 100 orders from the large number of orders that were filled and determines who filled the order. What is the name of the appropriate inference procedure? chi-square test for goodness of fit one-sample t-test for a difference in means two-sample t-test for a difference in means two-sample z-test for a difference in proportionsarrow_forwardExplain the four different types of sampling and give an example of each.arrow_forwardA sample of 300 items was selected. compute the p-valuearrow_forward
- Caden then performs a significance test. First, he performs 100 simulations. For each simulation, he randomly reorganizes the subjects into two groups, A and B, of size 10. In the simulations, group A plays the role of the treatment group and group B plays the role of the control group. After each simulation, he subtracts the average for group B from the average for group A. The distribution of the differences for all 100 simulations is shown in the histogram. 30 28 26 24 22 12 10 6. 2 Group A avg. - Group B avg. In the original experiment, the average for the treatment group was 0.8 higher than the average for the control group. Based on the 100 simulations, are the results of the experiment significant at the 5% level? yes no Number of simulations [-2.7, -2.2) [-2.2, -1.7) [-1.7, -1.2) [-1.2, -0.7) [-0.7, -0.2) [-0.2, 0.3) [0.3, 0.8) [0.8, 1.3) [1.3, 1.8) [1.8, 2.3) [2.3, 2.8)arrow_forwardA coach is interested in how many slam dunks the average college freshman at his university can do. Ten volunteers from the senior class step forward. After observing their performance, the coach concluded that college seniors can do an average of 10 slam dunks in a row without missing. what is the sample? what is the population?arrow_forwardA vaccine to prevent a severe virus was given to children within the first year of life as part of a drug study. The study reported that of the 3456bchildren randomly assigned the vaccine, 58 got the virus. Of the 1606 children randomly assigned the placebo, 46 got the virus. a. Find the sample percentage of children who caught the virus in each group. Is the sample percentage lower for the vaccine group, as investigators hoped? b. Determine whether the vaccine is effective in reducing the chance of catching the virus, using a significance level of 0.01.The first few steps of the hypothesis-testing procedure are given. Complete the procedure.arrow_forward
- Are cigarettes bad for people? Cigarette smoking involves tar, carbon monoxide, and nicotine (measured in milligrams). The first two are definitely not good for a person's health, and the last ingredient can cause addiction. Use the data in the table above to make a stem-and-leaf display for milligrams of tar per cigarette smoked. (Enter NONE in any unused answer blanks.) Are there any outliers? A. Yes, 1.0 may be an outlier. B. No, there are no outliers. C. Yes, 29.8 may be an outlier.arrow_forwardA professor wants to know which type of instructional mode students had more satisfaction. The professor randomly selected n = 5 students from each of the following types of classes: online only, hybrid, and face-to face only. Student were given a satisfaction survey. Are their differences in student satisfaction among the different instructional modes. The data are below: Online Hybrid Face-to-Face 3 3 4 3 3 1 3 1 3 2 2 2 2 1 3 Using the table in the back of the book, find the critical value for F (Fcrit) with α = .05.arrow_forwardSuppose 20% of the students on campus smoke. You select two students at random. In what percentage of samples will both students be smokers?arrow_forward
- A sample of Reese's pieces contains the following: 30 Orange, 40 Brown, 20 Yellow. What is the proportion of orange? Round to two places.arrow_forwardA researcher studying allergies to animals is interested in performing a study at the local elementary school. At Pineview Elementary, there are 4 1st grade classrooms. The researcher picks 2 of the 4 classrooms and asks every 1st grader in the 2 classrooms what type of animal they own (cat, dog, rabbit, etc.). He also asks how often they experience allergies. What is the sample?arrow_forward
arrow_back_ios
arrow_forward_ios
Recommended textbooks for you
- MATLAB: An Introduction with ApplicationsStatisticsISBN:9781119256830Author:Amos GilatPublisher:John Wiley & Sons Inc
 Probability and Statistics for Engineering and th...StatisticsISBN:9781305251809Author:Jay L. DevorePublisher:Cengage Learning
 Statistics for The Behavioral Sciences (MindTap C...StatisticsISBN:9781305504912Author:Frederick J Gravetter, Larry B. WallnauPublisher:Cengage Learning
  Elementary Statistics: Picturing the World (7th E...StatisticsISBN:9780134683416Author:Ron Larson, Betsy FarberPublisher:PEARSON
 The Basic Practice of StatisticsStatisticsISBN:9781319042578Author:David S. Moore, William I. Notz, Michael A. FlignerPublisher:W. H. Freeman
 Introduction to the Practice of StatisticsStatisticsISBN:9781319013387Author:David S. Moore, George P. McCabe, Bruce A. CraigPublisher:W. H. Freeman
MATLAB: An Introduction with Applications
Statistics
ISBN:9781119256830
Author:Amos Gilat
Publisher:John Wiley & Sons Inc
Probability and Statistics for Engineering and th...
Statistics
ISBN:9781305251809
Author:Jay L. Devore
Publisher:Cengage Learning
Statistics for The Behavioral Sciences (MindTap C...
Statistics
ISBN:9781305504912
Author:Frederick J Gravetter, Larry B. Wallnau
Publisher:Cengage Learning
Elementary Statistics: Picturing the World (7th E...
Statistics
ISBN:9780134683416
Author:Ron Larson, Betsy Farber
Publisher:PEARSON
The Basic Practice of Statistics
Statistics
ISBN:9781319042578
Author:David S. Moore, William I. Notz, Michael A. Fligner
Publisher:W. H. Freeman
Introduction to the Practice of Statistics
Statistics
ISBN:9781319013387
Author:David S. Moore, George P. McCabe, Bruce A. Craig
Publisher:W. H. Freeman