
A First Course in Probability (10th Edition)
10th Edition
ISBN: 9780134753119
Author: Sheldon Ross
Publisher: PEARSON
expand_more
expand_more
format_list_bulleted
Related questions
Question
A manufacturer knows that on average 20% of toasters produced require repairs within 1 year after they are sold. When 18 toasters are randomly selected, find the smallest number x and largest number y such that (a) the
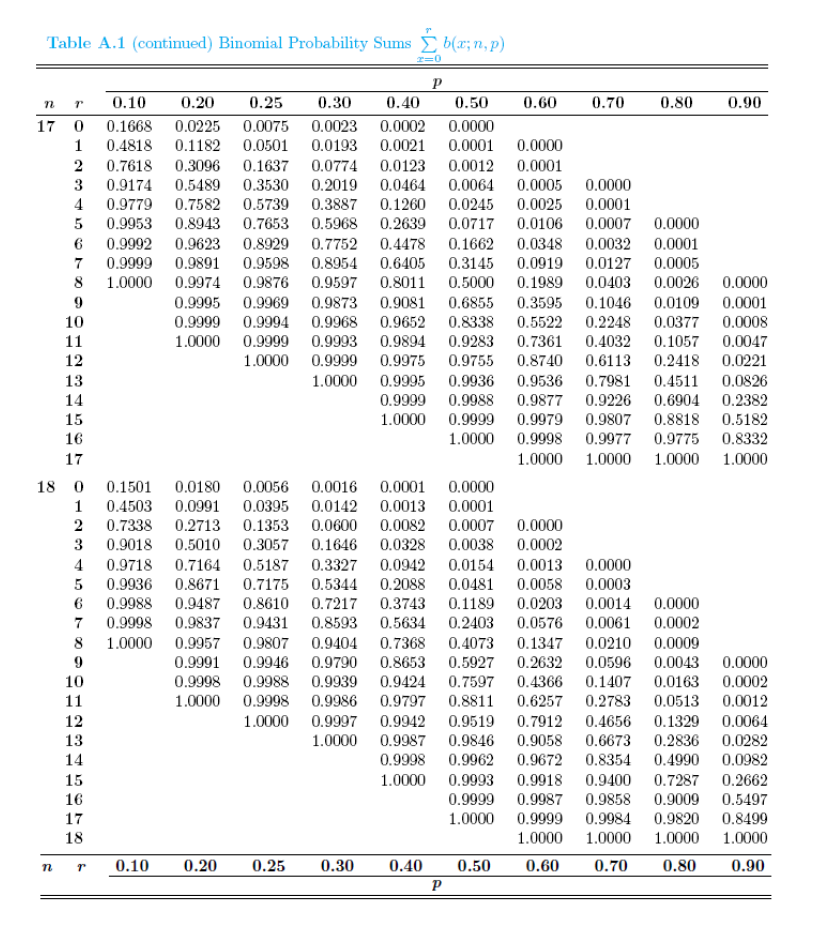

Transcribed Image Text:Table A.1 (continued) Binomial Probability Sums b(x;n, p)
n T 0.10
0.20
17 0 0.1668 0.0225
1 0.4818 0.1182
2 0.7618 0.3096 0.1637
3 0.9174 0.5489 0.3530 0.2019
0.9779 0.7582 0.5739 0.3887
4
5
0.9953 0.8943 0.7653
6
0.9992
8
1.0000
0.0047
0.9623 0.8929 0.7752 0.4478 0.1662 0.0348 0.0032 0.0001
7 0.9999 0.9891 0.9598 0.8954 0.6405 0.3145 0.0919 0.0127 0.0005
0.9974 0.9876 0.9597 0.8011 0.5000 0.1989 0.0403 0.0026 0.0000
0.9995 0.9969 0.9873 0.9081 0.6855 0.3595 0.1046 0.0109 0.0001
0.9999 0.9994 0.9968 0.9652 0.8338 0.5522 0.2248 0.0377 0.0008
1.0000 0.9999 0.9993 0.9894 0.9283 0.7361 0.4032 0.1057
1.0000 0.9999 0.9975 0.9755 0.8740 0.6113 0.2418 0.0221
1.0000 0.9995 0.9936 0.9536 0.7981 0.4511 0.0826
0.9999 0.9988 0.9877 0.9226 0.6904 0.2382
1.0000 0.9999 0.9979 0.9807 0.8818 0.5182
0.9998 0.9977 0.9775 0.8332
1.0000 1.0000 1.0000 1.0000
1.0000
9
10
11
12
n
13
14
15
16
17
18 0 0.1501
1
2
3
10
11
12
13
14
15
16
17
18
0.0180 0.0056
0.0016
0.0001
0.0000
0.4503 0.0991 0.0395
0.0142 0.0013
0.0001
0.7338 0.2713 0.1353 0.0600 0.0082
0.0007
0.9018 0.5010 0.3057 0.1646 0.0328 0.0038
4
0.9718
5 0.9936 0.8671 0.7175
6
0.7164 0.5187 0.3327 0.0942 0.0154 0.0013 0.0000
0.5344 0.2088 0.0481 0.0058 0.0003
0.9988 0.9487 0.8610 0.7217 0.3743
0.9837 0.9431 0.8593 0.5634
0.9957 0.9807
7
0.9998
8
1.0000
9
0.9991
0.9998
1.0000
P 0.10
0.40
0.25 0.30
0.0075 0.0023 0.0002
0.0501
0.0193 0.0021
0.20
x=0
0.50
0.0000
0.0001 0.0000
0.0774 0.0123 0.0012 0.0001
0.25
0.30
0.60
0.0464 0.0064 0.0005 0.0000
0.1260 0.0245 0.0025 0.0001
0.5968 0.2639 0.0717 0.0106 0.0007 0.0000
0.40
0.70
P
0.1189 0.0203 0.0014 0.0000
0.2403 0.0576 0.0061 0.0002
0.4073 0.1347 0.0210 0.0009
0.9998 0.9986
1.0000 0.9997
1.0000
0.9404 0.7368
0.9946 0.9790 0.8653 0.5927 0.2632 0.0596 0.0043 0.0000
0.9988 0.9939 0.9424 0.7597 0.4366 0.1407 0.0163 0.0002
0.9797 0.8811 0.6257 0.2783 0.0513 0.0012
0.9942 0.9519 0.7912 0.4656 0.1329 0.0064
0.9987 0.9846 0.9058 0.6673 0.2836 0.0282
0.9998 0.9962 0.9672 0.8354 0.4990 0.0982
1.0000 0.9993 0.9918 0.9400 0.7287 0.2662
0.9858 0.9009
0.5497
0.9999 0.9987
1.0000 0.9999
0.9984 0.9820
0.8499
1.0000 1.0000 1.0000
1.0000
0.60 0.70
0.80
0.90
0.50
0.0000
0.0002
0.80
0.90

Transcribed Image Text:Table A.1 (continued) Binomial Probability Sums b(x; n, p)
n
0.20
0.25 0.30 0.40
19 0
0.1351
0.0144
0.0042
0.0011
0.0001
1
0.4203
0.0829
0.0310
0.0104
0.0008
2 0.7054
0.2369
0.1113 0.0462 0.0055
3 0.8850
0.4551
0.2631 0.1332 0.0230
0.6733 0.4654 0.2822 0.0696
5 0.9914 0.8369 0.6678 0.4739 0.1629
4 0.9648
P 0.10
n
7
8
9
10
11
12
13
14
15
16
17
18
19
10
11
12
13
14
15
16
17
18
19
20
r
0.0835 0.0116 0.0006
0.1796 0.0352 0.0028 0.0000
0.0885 0.0105 0.0003
0.5000 0.1861 0.0326
6 0.9983 0.9324 0.8251 0.6655 0.3081
0.9997 0.9767 0.9225 0.8180 0.4878
1.0000 0.9933 0.9713 0.9161 0.6675 0.3238
0.9984 0.9911 0.9674 0.8139
0.0016
0.9997 0.9977 0.9895 0.9115 0.6762 0.3325 0.0839 0.0067 0.0000
1.0000 0.9995 0.9972 0.9648 0.8204 0.5122 0.1820 0.0233 0.0003
0.9999 0.9994 0.9884 0.9165 0.6919 0.3345 0.0676 0.0017
1.0000 0.9999 0.9969 0.9682 0.8371 0.5261 0.1631 0.0086
1.0000 0.9994 0.9904 0.9304 0.7178 0.3267
0.9999 0.9978 0.9770 0.8668 0.5449
1.0000
0.0352
0.1150
0.9996
0.9945 0.9538 0.7631
0.2946
1.0000
0.9992 0.9896 0.9171 0.5797
0.9999 0.9989 0.9856 0.8649
1.0000 1.0000
1.0000
1.0000
0.0115
0.3917 0.0692
0.6769 0.2061 0.0913
2=0
0.0032
0.0243 0.0076
20 0 0.1216
1
0.0005 0.0000
2
0.0355 0.0036 0.0002
0.0000
3 0.8670 0.4114 0.2252 0.1071 0.0160 0.0013
4 0.9568 0.6296 0.4148 0.2375 0.0510 0.0059 0.0003
5 0.9887 0.8042 0.6172
6
0.4164
0.9976 0.9133 0.7858 0.6080
0.9996 0.9679 0.8982 0.7723
0.9999
9 1.0000
7
8
0.10
0.0008 0.0000
P
0.20 0.25 0.30
0.50
0.40
0.60
P
0.0000
0.0004 0.0000
0.0022 0.0001
0.0096 0.0006 0.0000
0.0318 0.0031 0.0001
0.1256 0.0207 0.0016 0.0000
0.2500
0.0577 0.0065 0.0003
0.1316 0.0210 0.0013 0.0000
0.2517 0.0565 0.0051 0.0001
0.4119 0.1275 0.0171 0.0006
0.4159
0.9900 0.9591 0.8867 0.5956
0.9974 0.9861 0.9520 0.7553
0.9994 0.9961 0.9829 0.8725 0.5881 0.2447 0.0480 0.0026 0.0000
0.9999 0.9991 0.9949 0.9435 0.7483 0.4044 0.1133 0.0100 0.0001
1.0000 0.9998 0.9987 0.9790 0.8684 0.5841 0.2277 0.0321 0.0004
1.0000 0.9997 0.9935 0.9423 0.7500 0.3920 0.0867 0.0024
1.0000 0.9984 0.9793 0.8744 0.5836 0.1958 0.0113
0.9997 0.9941 0.9490 0.7625 0.3704 0.0432
1.0000 0.9987 0.9840 0.8929 0.5886 0.1330
0.9998 0.9964 0.9645 0.7939 0.3231
1.0000 0.9995 0.9924 0.9308 0.6083
1.0000 0.9992 0.9885 0.8784
1.0000 1.0000 1.0000
0.70 0.80 0.90
0.70 0.80
0.50
0.90
0.60
Expert Solution
This question has been solved!
Explore an expertly crafted, step-by-step solution for a thorough understanding of key concepts.

This is a popular solution

Trending nowThis is a popular solution!

Step by stepSolved in 4 steps with 22 images

Knowledge Booster

Similar questions
- The manager at the local auto shop has found that the probability that a car brought into the shop requires an oil change is 0.65, the probability that a car brought into the shop requires brake repair is 0.35, and the probability that a car requires both an oil change and brake repair is 0.24. For a car brought into the shop, determine the probability that the car will require an oil change or brake repair. The probability that the car requires an oil change or brake repair is (Type an integer or a decimal.)arrow_forwardAssume that three stop lights on the way to school are independent. Their time probabilities are P(Red)=0.4, P(Green)=0.5, and P(Yellow)=0.1 values. What is the probability of getting ALL THREE green lights on a trip to school?arrow_forwardSuppose you want to estimate the probability that a patient will develop an infection while hospitalized at a particular hospital. In the past year, this hospital had 8,650 patients, and 812 of them developed an infection. What is the estimated probability that a patient at this hospital will develop an infection? 812 O P(the patient develops an infection) 8650 1 P(the patient develops an infection) = 8650 5738 O P(the patient develops an infection) 8650 O P(the patient develops an infection) = 812 812 O P(the patient develops an infection) 5738arrow_forward
- Suppose we played roulette x5 times (where x = 3 is the last digit of your student ID) and each time we bet on the number 17. In each game, xthe probability of winning is 1/37. Calculate the probability P(X = z), where z is the second-to-last digit of your student ID (in this case, z = 5). Draw the probability distribution function graph for the given scenario. Also, calculate the probability of winning less than 5 timesDo this task in R commander.arrow_forwardA ballet instructor is interested in knowing what percent of each year's class will continue on to the next, so that she can plan what classes to offer. Over the years, she has established the following probability distribution. • Let X = the number of years a student will study ballet with the teacher. • Let P(x) = the probability that a student will study ballet x years. Complete the table below using the data provided. (Enter exact numbers as integers, fractions, or decimals.) x P(x) x*P(x) 1 0.10 2 0.10 3 0.20 4 5 0.20 6 0.20 7 0.05arrow_forwardFind the probability P(Ec) if P(E)=0.17.arrow_forward
arrow_back_ios
arrow_forward_ios
Recommended textbooks for you
- A First Course in Probability (10th Edition)ProbabilityISBN:9780134753119Author:Sheldon RossPublisher:PEARSON

A First Course in Probability (10th Edition)
Probability
ISBN:9780134753119
Author:Sheldon Ross
Publisher:PEARSON