
MATLAB: An Introduction with Applications
6th Edition
ISBN: 9781119256830
Author: Amos Gilat
Publisher: John Wiley & Sons Inc
expand_more
expand_more
format_list_bulleted
Related questions
Question
ST8
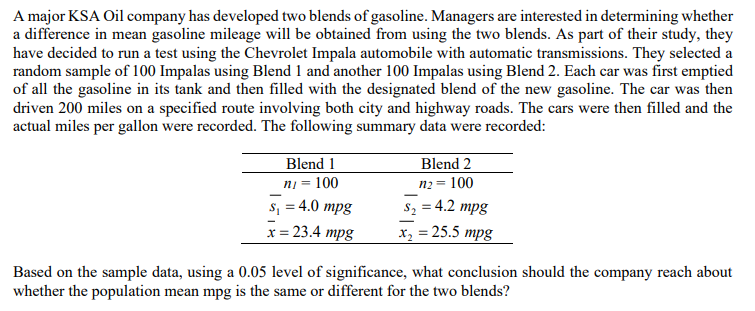

Transcribed Image Text:A major KSA Oil company has developed two blends of gasoline. Managers are interested in determining whether
a difference in mean gasoline mileage will be obtained from using the two blends. As part of their study, they
have decided to run a test using the Chevrolet Impala automobile with automatic transmissions. They selected a
random sample of 100 Impalas using Blend 1 and another 100 Impalas using Blend 2. Each car was first emptied
of all the gasoline in its tank and then filled with the designated blend of the new gasoline. The car was then
driven 200 miles on a specified route involving both city and highway roads. The cars were then filled and the
actual miles per gallon were recorded. The following summary data were recorded:
Blend 1
ni = 100
s₁ = 4.0 mpg
x = 23.4 mpg
Blend 2
n₂ = 100
S₂ = 4.2 mpg
x₂ = 25.5 mpg
Based on the sample data, using a 0.05 level of significance, what conclusion should the company reach about
whether the population mean mpg is the same or different for the two blends?
Expert Solution
This question has been solved!
Explore an expertly crafted, step-by-step solution for a thorough understanding of key concepts.

Step by stepSolved in 3 steps with 1 images

Knowledge Booster

Similar questions
- 34+76arrow_forward8VT50arrow_forwardMany institutes, departments, and recruitment committees are using citations as part of the assessment process involved in making new appointments. By going through scientific databases like Scopusselection panels can check if a candidate’s work is making an impact by being cited by other researchers in their field. How does the scientific community measure how "good" or "great" a journal or an author is? How do you determine the "impact" of an author's work? The most 2common metric to track an author's impact is ask how often they are cited. The following table presents the number of citation on research publications of two Management Science professors over a period of 17years, 2005 to 2021, data taken from Google Scholar. The objective of this assignment is to find a suitable forecasting method (moving average, exponential smoothing, and/or simple linear regression model) to predict near future citation of a researcher. (a) For each professor, develop a scatter diagram on his…arrow_forward
arrow_back_ios
arrow_forward_ios
Recommended textbooks for you
- MATLAB: An Introduction with ApplicationsStatisticsISBN:9781119256830Author:Amos GilatPublisher:John Wiley & Sons Inc
 Probability and Statistics for Engineering and th...StatisticsISBN:9781305251809Author:Jay L. DevorePublisher:Cengage Learning
 Statistics for The Behavioral Sciences (MindTap C...StatisticsISBN:9781305504912Author:Frederick J Gravetter, Larry B. WallnauPublisher:Cengage Learning
  Elementary Statistics: Picturing the World (7th E...StatisticsISBN:9780134683416Author:Ron Larson, Betsy FarberPublisher:PEARSON
 The Basic Practice of StatisticsStatisticsISBN:9781319042578Author:David S. Moore, William I. Notz, Michael A. FlignerPublisher:W. H. Freeman
 Introduction to the Practice of StatisticsStatisticsISBN:9781319013387Author:David S. Moore, George P. McCabe, Bruce A. CraigPublisher:W. H. Freeman
MATLAB: An Introduction with Applications
Statistics
ISBN:9781119256830
Author:Amos Gilat
Publisher:John Wiley & Sons Inc
Probability and Statistics for Engineering and th...
Statistics
ISBN:9781305251809
Author:Jay L. Devore
Publisher:Cengage Learning
Statistics for The Behavioral Sciences (MindTap C...
Statistics
ISBN:9781305504912
Author:Frederick J Gravetter, Larry B. Wallnau
Publisher:Cengage Learning
Elementary Statistics: Picturing the World (7th E...
Statistics
ISBN:9780134683416
Author:Ron Larson, Betsy Farber
Publisher:PEARSON
The Basic Practice of Statistics
Statistics
ISBN:9781319042578
Author:David S. Moore, William I. Notz, Michael A. Fligner
Publisher:W. H. Freeman
Introduction to the Practice of Statistics
Statistics
ISBN:9781319013387
Author:David S. Moore, George P. McCabe, Bruce A. Craig
Publisher:W. H. Freeman