MATLAB: An Introduction with Applications
6th Edition
ISBN: 9781119256830
Author: Amos Gilat
Publisher: John Wiley & Sons Inc
expand_more
expand_more
format_list_bulleted
Question

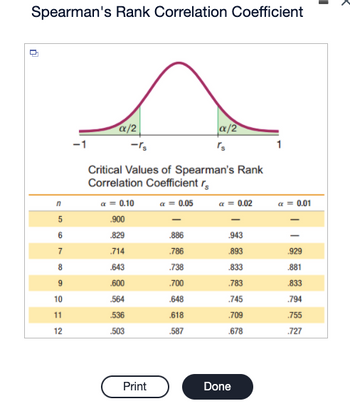
Transcribed Image Text:Spearman's Rank Correlation Coefficient
0
n
5
7
8
10
11
12
α/2
-rs
Critical Values of Spearman's Rank
Correlation Coefficient r
a = 0.10
α = 0.05
.900
829
.714
.643
.600
.564
.536
.503
Print
.886
.786
.738
.700
.648
α/2
.618
587
x = 0.02
.943
.893
.833
.783
.745
.709
.678
Done
0.01
929
.881
.833
.794
.755
.727

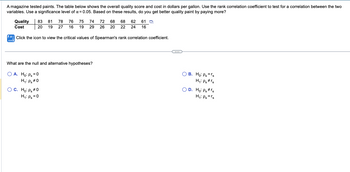
Transcribed Image Text:A magazine tested paints. The table below shows the overall quality score and cost in dollars per gallon. Use the rank correlation coefficient to test for a correlation between the two
variables. Use a significance level of x = 0.05. Based on these results, do you get better quality paint by paying more?
Quality 83 81 78 76 75
Cost
74
19 29
20 19 27 16
19
Click the icon to view the critical values of Spearman's rank correlation coefficient.
What are the null and alternative hypotheses?
O A.
Ho: P₂ = 0
H₁: P₂ #0
O C. Ho: P₂ #0
H₁: Ps=0
72
72
68 68 62 61
22 24 16
24
26 20 22
C
OB. Ho: Ps='s
H₁: Ps #rs
O D. Ho: Ps #rs
H₁: Ps = rs
Expert Solution
This question has been solved!
Explore an expertly crafted, step-by-step solution for a thorough understanding of key concepts.
This is a popular solution
Trending nowThis is a popular solution!
Step by stepSolved in 2 steps

Knowledge Booster
Similar questions
- You wish to determine if there is a positive linear correlation between the age of a driver and the number of driver deaths. The following table represents the age of a driver and the number of driver deaths per 100,000. Use a significance level of 0.05 and round all values to 4 decimal places. Driver Age Number of Driver Deaths per 100,000 21 19 27 20 58 31 77 31 47 24 50 26 Ho: ρ = 0Ha: ρ > 0 Find the Linear Correlation Coefficient r = Find the p-value p-value = The p-value is Greater than αα Less than (or equal to) αα The p-value leads to a decision to Reject Ho Accept Ho Do Not Reject Hoarrow_forwardThe following data represent the daily supply and the unit price for a product. Compute and interpret the sample correlation coefficient. Daily Supply (y) Unit Price (x) 5 2 7 4 9 8 12 5 10 7 13 8 16 16 16 6arrow_forwardLet x be the average number of employees in a group health insurance plan, and let y be the average administrative cost as a percentage of claims. x 3 7 15 32 75 y 40 35 30 26 18 (a) Make a scatter diagram of the data and visualize the line you think best fits the data. Flash Player version 10 or higher is required for this question. You can get Flash Player free from Adobe's website. (b) Would you say the correlation is low, moderate, or strong? positive or negative? strong and negative moderate and negative strong and positive low and negative low and positive moderate and positive (c) Use a calculator to verify that Σx = 132, Σx2 = 6932, Σy = 149, Σy2 = 4725, and Σxy = 2997. Compute r. (Round your answer to three decimal places.)r = As x increases, does the value of r imply that y should tend to increase or decrease? Explain. Given our value of r, we cannot draw any conclusions for the behavior of y as x increases. Given our value of r, y should tend to…arrow_forward
- You wish to determine if there is a linear correlation between the age of a driver and the number of driver deaths. The following table represents the age of a driver and the number of driver deaths per 100,000. Use a significance level of 0.01 and round all values to 4 decimal places. Driver Age Number of Driver Deaths per 100,000 65 27 34 27 76 24 55 34 71 21 49 24 34 36 27 19 Ho: ρ = 0Ha: ρ ≠ 0 Find the Linear Correlation Coefficient r = Find the p-value p-value = The p-value is Less than (or equal to) αα Greater than αα The p-value leads to a decision to Reject Ho Accept Ho Do Not Reject Ho The conclusion is There is a significant positive linear correlation between driver age and number of driver deaths. There is a significant linear correlation between driver age and number of driver deaths. There is a significant negative linear correlation between driver age and number of driver deaths. There is insufficient evidence to make a…arrow_forwardUsing technology, what is the correlation coefficient? The weight (in pounds) and height (in inches) for a child were measured every few months over a two-year period. The results are given in the table. O -0.997 O -0.503 Weight (x) 8. 12 18 24 30 32 35 37 40 O 0.503 Height (y) 22 23 26 30 32 33 5 36 38 O 0.997arrow_forwardUnattemptedQuestion 1Expand PreviousNext The data below was collected from manufacturer advertisements of their vehicles' horsepower and highway gas mileage (mpg.). Use this data to answer the following questions. x 158 250 340 350 390 190 220 y 33 28 15 17 11 35 42 1. Find the p-value to determine if there is a linear correlation between horsepower and highway gas mileage (mpg). If there is a linear correlation, write the correlation coefficient below if there is a linear correlation, write the regression equation below. Using the data shown above, predict the the highway gas mileage (mpg) for a car that has a horsepower of 225 If there is a linear correlation, what percentage of variation in highway gas mileage (mpg) can be explained by horsepower?arrow_forward
- Use the data values in the table below to calculate the correlation between the variables x and y. Submit the link through Canvas to either a photo of your work on paper or a link to a google sheet. y 4 27.22 5 23.83 6 23.94 7 22.85 8 20.96 9 17.07 10 14.68 11 16.49 12 14.6 Give your answer to three decimal places.arrow_forwardA researcher wants to see if the fat content in burgers and their calories are related. Fat (g) Calories What is the correlation coefficient, r ? O210.954 11.055 O 0.922815 19 31 34 35 39 39 43 410 580 590 570 640 680 660 O 0.960633 DELLarrow_forward2. A study was conducted to determine the relationship between a person’s monthly income in Omani Rials and the number of meals that person eats away from home per month. The data are shown below.arrow_forward
arrow_back_ios
arrow_forward_ios
Recommended textbooks for you
 MATLAB: An Introduction with ApplicationsStatisticsISBN:9781119256830Author:Amos GilatPublisher:John Wiley & Sons Inc
 Probability and Statistics for Engineering and th...StatisticsISBN:9781305251809Author:Jay L. DevorePublisher:Cengage Learning
 Statistics for The Behavioral Sciences (MindTap C...StatisticsISBN:9781305504912Author:Frederick J Gravetter, Larry B. WallnauPublisher:Cengage Learning
 Elementary Statistics: Picturing the World (7th E...StatisticsISBN:9780134683416Author:Ron Larson, Betsy FarberPublisher:PEARSON
 The Basic Practice of StatisticsStatisticsISBN:9781319042578Author:David S. Moore, William I. Notz, Michael A. FlignerPublisher:W. H. Freeman
 Introduction to the Practice of StatisticsStatisticsISBN:9781319013387Author:David S. Moore, George P. McCabe, Bruce A. CraigPublisher:W. H. Freeman

MATLAB: An Introduction with Applications
Statistics
ISBN:9781119256830
Author:Amos Gilat
Publisher:John Wiley & Sons Inc

Probability and Statistics for Engineering and th...
Statistics
ISBN:9781305251809
Author:Jay L. Devore
Publisher:Cengage Learning

Statistics for The Behavioral Sciences (MindTap C...
Statistics
ISBN:9781305504912
Author:Frederick J Gravetter, Larry B. Wallnau
Publisher:Cengage Learning

Elementary Statistics: Picturing the World (7th E...
Statistics
ISBN:9780134683416
Author:Ron Larson, Betsy Farber
Publisher:PEARSON

The Basic Practice of Statistics
Statistics
ISBN:9781319042578
Author:David S. Moore, William I. Notz, Michael A. Fligner
Publisher:W. H. Freeman

Introduction to the Practice of Statistics
Statistics
ISBN:9781319013387
Author:David S. Moore, George P. McCabe, Bruce A. Craig
Publisher:W. H. Freeman