
MATLAB: An Introduction with Applications
6th Edition
ISBN: 9781119256830
Author: Amos Gilat
Publisher: John Wiley & Sons Inc
expand_more
expand_more
format_list_bulleted
Related questions
Concept explainers
Question
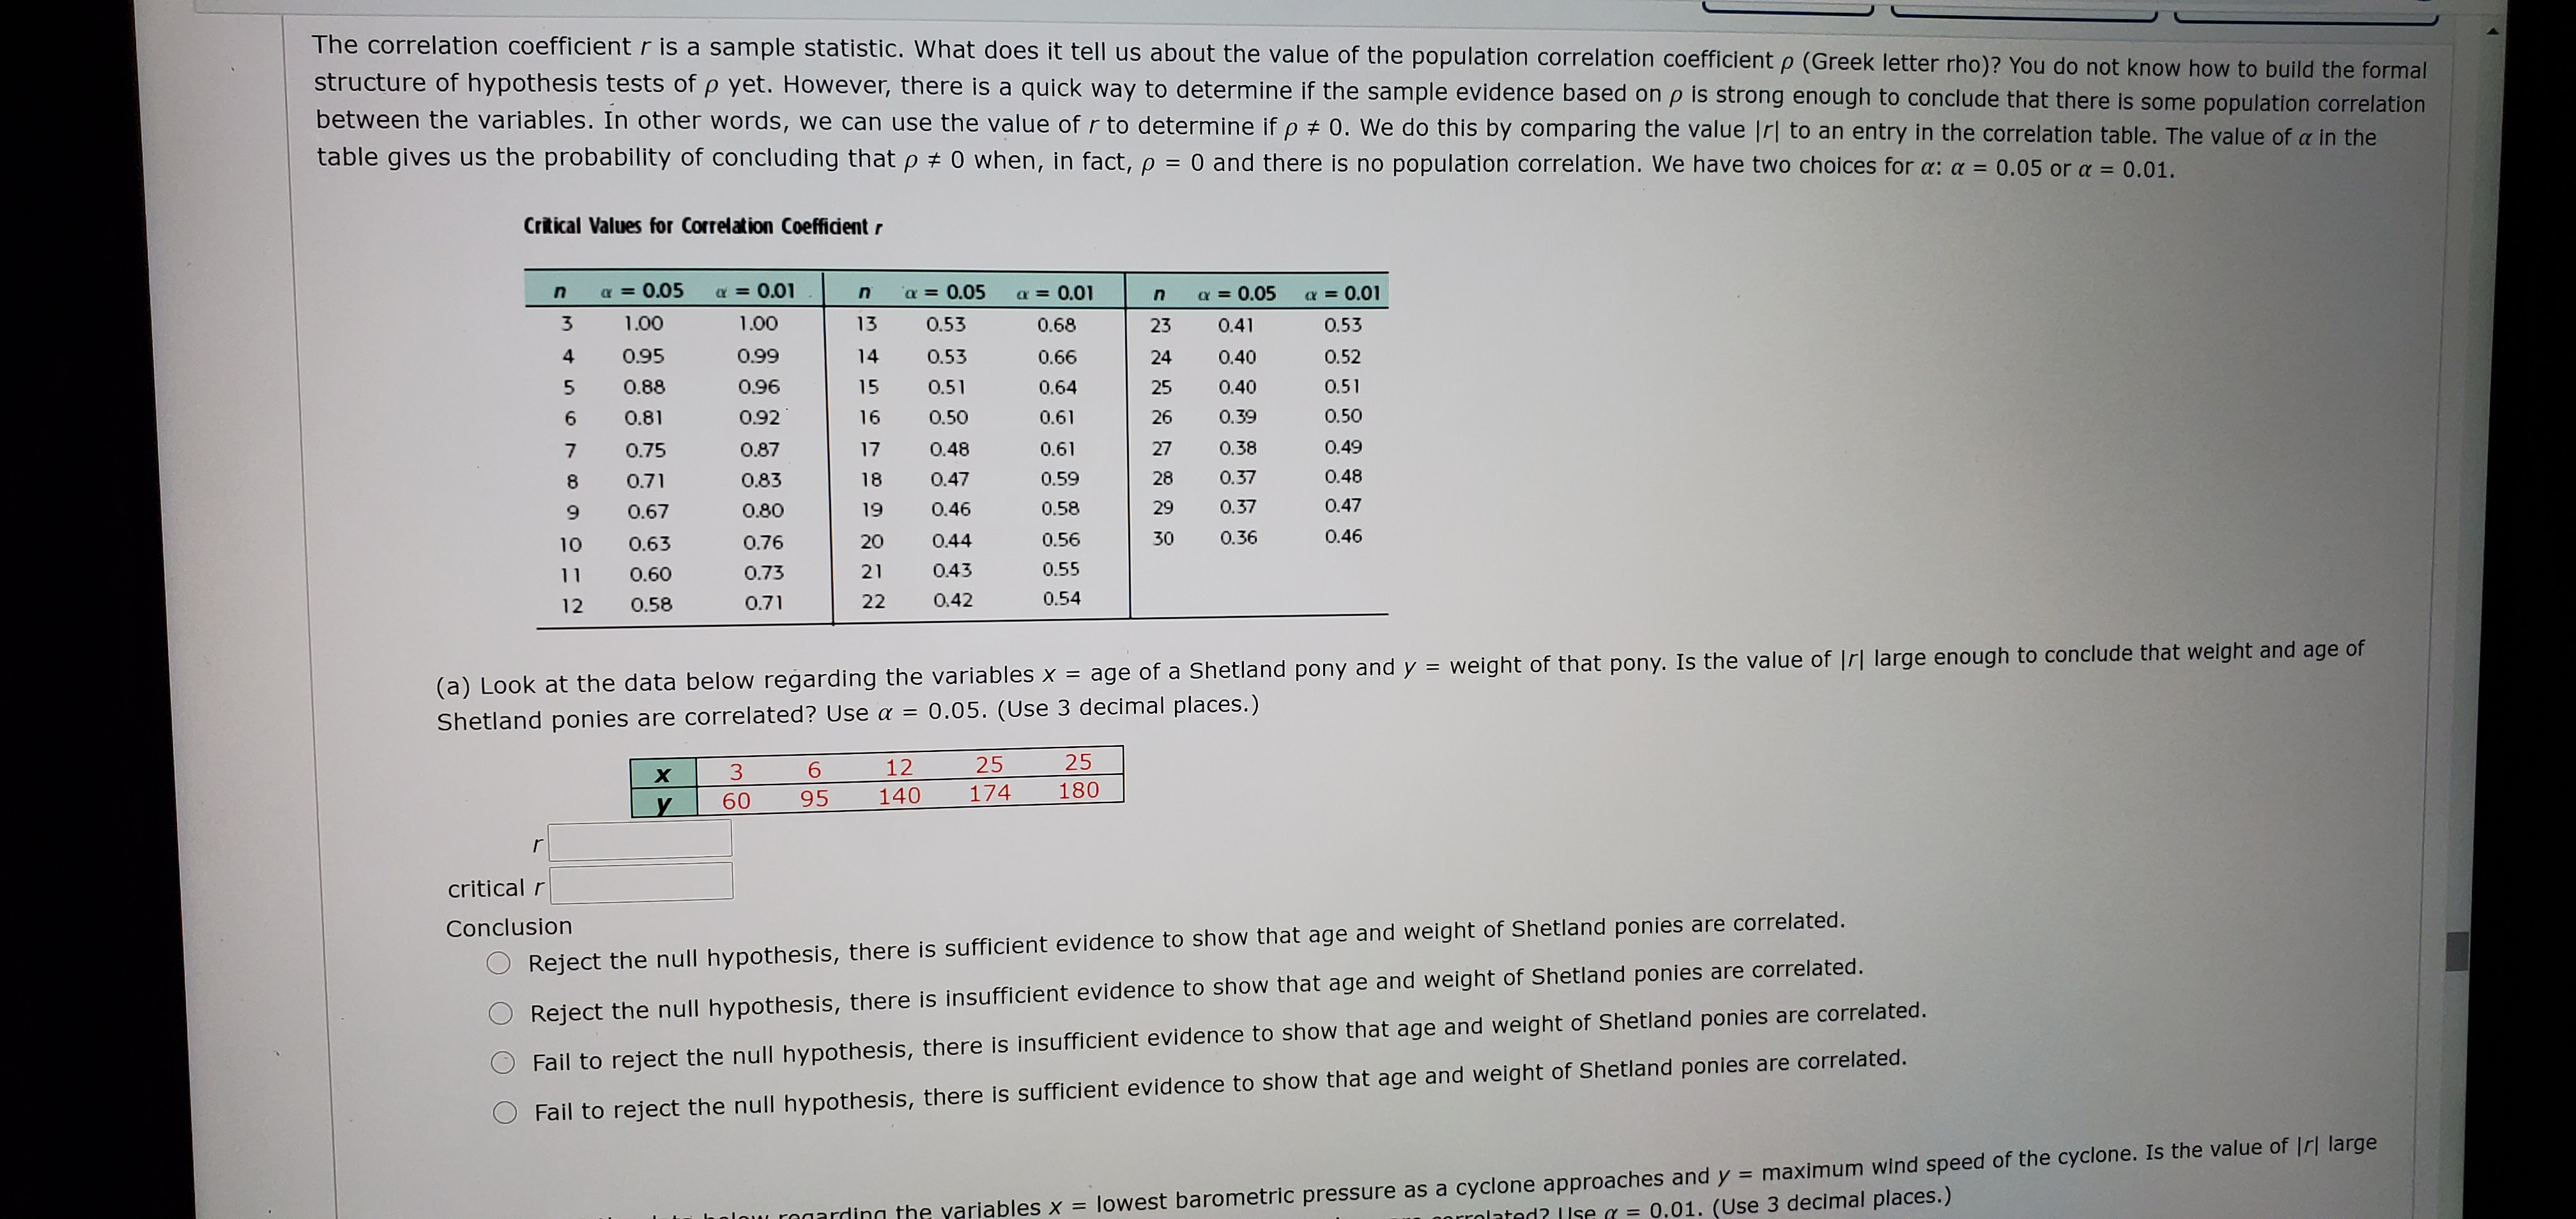


Transcribed Image Text:(a) Look at the data below regarding the variables x =
age of a Shetland pony and y
weight of that pony. Is the value of Ir| large enough to conclude that weight and age
Shetland ponies are correlated? Use a =
0.05. (Use 3 decimal places.)
3
12
25
25
60
95
140
174
180
critical r
Conclusion
Reject the null hypothesis, there is sufficient evidence to show that age and weight of Shetland ponies are correlated.
Reject the null hypothesis, there is insufficient evidence to show that age and weight of Shetland ponies are correlated.
Fail to reject the null hypothesis, there is insufficient evidence to show that age and weight of Shetland ponies are correlated.
Fail to reject the null hypothesis, there is sufficient evidence to show that age and weight of Shetland ponies are correlated.
(b) Look at the data below regarding the variables x = lowest barometric pressure as a cyclone approaches and y = maximum wind speed of the cyclone. Is the value of Ir| lan
%3D
enough to conclude that lowest barometric pressure and wind speed of a cyclone are correlated? Use a
0.01. (Use 3 decimal places.)
1004
975
992
935
980
928
40
100
65
145
68
152
r
critical r
Conclusion
Reject the null hypothesis, there is sufficient evidence to show that lowest barometric pressure and maximum wind speed for cyclones are correlated.
Reject the null hypothesis, there is insufficient evidence to show that lowest barometric pressure and maximum wind speed for cyclones are correlated.
Fail to reject the null hypothesis, there is insufficient evidence to show that lowest barometric pressure and maximum wind speed for cyclones are correlated.
Fail to reject the null hypothesis, there is sufficient evidence to show that lowest barometric pressure and maximum wind speed for cyclones are correlated.
Expert Solution
This question has been solved!
Explore an expertly crafted, step-by-step solution for a thorough understanding of key concepts.

This is a popular solution

Trending nowThis is a popular solution!

Step by stepSolved in 6 steps with 6 images

Knowledge Booster


Learn more about
Need a deep-dive on the concept behind this application? Look no further. Learn more about this topic, statistics and related others by exploring similar questions and additional content below.Similar questions
- What are the hypotheses for testing to see if a correlation is statistically significant? Hor=0: H₁r0 Ho: p=0: H₁p0 Ho: p= ±1: H₁p #±1 Ho: p = 0; H₁:p=1 Ho: r = ±1; H₁: r#±1arrow_forwardSuppose we compute a correlation coefficient between two variable of r= 0. Which of the following must be true. O a. The correlation conditions have not been met O b. There is an outlier present in the scatterplot O c. There is no linear relationship between the two variables O d. There is no relationship at all between the two variables A Click Submit to complete this assessment. A Stat100_Practice..pdf Writing Prompt 3.docx Online Syllabus J....pdf 3 Bios357Schedul...pd ips-D056AE4A- Ips-53E329A5-0A IMG_S E23F-45...p4.movE6-4E6...mp4.mov OCT 」國TO 22 6. 20 F3 F1 O00 F2 F4 F5arrow_forward13. Perform a formal test for correlation on the chocolate consumption / Nobel prize winners data in chocolate_nobels.xls. H0: There is no correlation between chocolate consumption and the number of Nobel prize winners (=0) H1: There is a correlation between chocolate consumption and the number of Nobel prize winners ( is not 0) True or false: The null hypothesis should be rejected based on your analysis in the preceding questions. True or False???arrow_forward
- Note that this uses minitab. Make a scatterplot that will enable you to predict BBAC from number of beers consumed. What is the correlation coefficient?arrow_forwardCould you help me with this. With work if possiblearrow_forwardThe data below was taken from the fat (g) and sodium (mg) found in different types of food found at fast food restaurants. 19 31 34 35 39 39 43 _y 920 1310 860 1180 940 1260 1500 a) Find the p-value to determine if there is a linear correlation between fat (g) and sodium (mg). Record the p-value below. Round to four decimal places. p-value = b) Is there a linear correlation between fat (g) and sodium (mg)? c) If there is a linear correation, write the correlation coefficient below. Otherwise, leave it blank. Round your final answer to four decimal places. d) If there is a linear correlation, write the regression equation below. Otherwise, leave it blank. Round all numbers to four decimal places. e) Using the data shown above, predict the the sodium found in fast food when the fat is 32 g. Round your final answer to two decimal places. f) If there is a linear correlation, what percentage of variation in sodium (mg) can be explained by fat (g)? If there is not a linear correlation, leave…arrow_forward
arrow_back_ios
arrow_forward_ios
Recommended textbooks for you
- MATLAB: An Introduction with ApplicationsStatisticsISBN:9781119256830Author:Amos GilatPublisher:John Wiley & Sons Inc
 Probability and Statistics for Engineering and th...StatisticsISBN:9781305251809Author:Jay L. DevorePublisher:Cengage Learning
 Statistics for The Behavioral Sciences (MindTap C...StatisticsISBN:9781305504912Author:Frederick J Gravetter, Larry B. WallnauPublisher:Cengage Learning
  Elementary Statistics: Picturing the World (7th E...StatisticsISBN:9780134683416Author:Ron Larson, Betsy FarberPublisher:PEARSON
 The Basic Practice of StatisticsStatisticsISBN:9781319042578Author:David S. Moore, William I. Notz, Michael A. FlignerPublisher:W. H. Freeman
 Introduction to the Practice of StatisticsStatisticsISBN:9781319013387Author:David S. Moore, George P. McCabe, Bruce A. CraigPublisher:W. H. Freeman
MATLAB: An Introduction with Applications
Statistics
ISBN:9781119256830
Author:Amos Gilat
Publisher:John Wiley & Sons Inc
Probability and Statistics for Engineering and th...
Statistics
ISBN:9781305251809
Author:Jay L. Devore
Publisher:Cengage Learning
Statistics for The Behavioral Sciences (MindTap C...
Statistics
ISBN:9781305504912
Author:Frederick J Gravetter, Larry B. Wallnau
Publisher:Cengage Learning
Elementary Statistics: Picturing the World (7th E...
Statistics
ISBN:9780134683416
Author:Ron Larson, Betsy Farber
Publisher:PEARSON
The Basic Practice of Statistics
Statistics
ISBN:9781319042578
Author:David S. Moore, William I. Notz, Michael A. Fligner
Publisher:W. H. Freeman
Introduction to the Practice of Statistics
Statistics
ISBN:9781319013387
Author:David S. Moore, George P. McCabe, Bruce A. Craig
Publisher:W. H. Freeman