MATLAB: An Introduction with Applications
6th Edition
ISBN: 9781119256830
Author: Amos Gilat
Publisher: John Wiley & Sons Inc
expand_more
expand_more
format_list_bulleted
Question

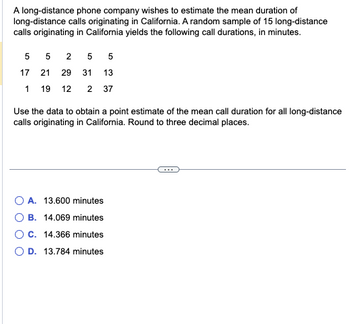
Transcribed Image Text:A long-distance phone company wishes to estimate the mean duration of
long-distance calls originating in California. A random sample of 15 long-distance
calls originating in California yields the following call durations, in minutes.
5 525 5
17 21 29 31 13
119 12 2 37
Use the data to obtain a point estimate of the mean call duration for all long-distance
calls originating in California. Round to three decimal places.
O A. 13.600 minutes
B. 14.069 minutes
C. 14.366 minutes
O D. 13.784 minutes
Expert Solution
This question has been solved!
Explore an expertly crafted, step-by-step solution for a thorough understanding of key concepts.
Step by stepSolved in 2 steps

Knowledge Booster
Similar questions
- Students in an experimental psychology class did research on depression as a sign of stress. A test was administered to a sample of 30 students. The scores are given. Complete parts (a) through (c) below. 32 54 11 15 35 21 OA. 158 34 15 55 51 11 35 2 1457 3 1234567 4123445566 511245666 34 33 46 OB. 11155 (a) Find the mean and median of the data. The mean is . (Round to three decimal places as needed.) 44 26 27 The median is .(Type an integer or a decimal.) (b) Draw a stem-and-leaf plot for the data using one row per stem. Which stem-and-leaf plot below shows the data? 2 112677 3 233445556 4 244666 5 1456 ... 21 42 38 OA. The distribution is symmetric. B. The distribution is skewed right (positively skewed). OC. The distribution is skewed left (negatively skewed). O D. The distribution is uniform. (c) Describe the shape of the distribution. Which description below best describes the shape of the distribution? 56 46 OC. 1112455668 2 14556 3 15 4 13457 5 223446667 46 27 33 35 22 44 36 0…arrow_forwardd. Interpret the value of IQR in the above table.arrow_forwardThe mean number of sick days an employee takes per year is believed to be about 10.5. Members of a personnel department do not believe this figure. They randomly survey ten employees. The number of sick days they took for the past year are as follows: 12; 4; 15; 3; 11; 8; 6; 8; 2; 9. Let x = the number of sick days they took for the past year. Should the personnel team believe that the mean number is ten?arrow_forward
- 8235#/full Pork... EmblemHealth Fin... ACCESS HRA - ACC... Account Link - ACC.. The mean score on this test is: 6.06 The median score on this test is: 6 Add Work Question 2 Find the five-number summary for the following data set. 87 84 89 88 89 81 82 89 88 84 Min Q1 Median Q3 Max 81 82 887.5 88 89 Add Work Question 3 The boxplots below shows salaries for Construction workers and Teachers Construction Teacherarrow_forwardThe 2018 General Social Survey contains information on the number of 1F poor mental health days adults in the US had in the last month. The data arę below. Calculate the standard error of the mean number of poor health days for females. Table 1. Mean number of poor mental health days in the last 30 days by sex Male Female Total Mean S.D. 3.55 6.78 1408 3.02 4.06 6.43 7.07 678 730 Source GSS 2018 Your answerarrow_forwardThe accompanying table contains the overall download and upload speeds in mbps for nine carriers in a particular country. a. Compute the mean and median. Data table The mean download speed is (Type an integer or decimal rounded to two decimal places as needed.) Carrier Download Speed Upload Speed Carrier 1 22.7 14.9 The mean upload speed is. (Type an integer or decimal rounded to two decimal places as needed.) Carrier 2 22.0 12.9 Carrier 3 20.7 8.8 The median download speed is. Carrier 4 16.6 11.1 (Type an integer or decimal rounded to two decimal places as needed.) Carrier 5 11.5 6.1 Carrier 6 9.9 6.5 The median upload speed is. (Type an integer or decimal rounded to two decimal places as needed.) Carrier 7 10.6 6.5 Carrier 8 6.7 3.0 b. Compute the variance, standard deviation, range, and coefficient of variation. Carrier 9 4.3 3.9 The variance for the download speeds is. (Type an integer or decimal rounded to two decimal places as needed.) Print Dore P Type here to search 7. 3. T Y.…arrow_forward
arrow_back_ios
arrow_forward_ios
Recommended textbooks for you
 MATLAB: An Introduction with ApplicationsStatisticsISBN:9781119256830Author:Amos GilatPublisher:John Wiley & Sons Inc
 Probability and Statistics for Engineering and th...StatisticsISBN:9781305251809Author:Jay L. DevorePublisher:Cengage Learning
 Statistics for The Behavioral Sciences (MindTap C...StatisticsISBN:9781305504912Author:Frederick J Gravetter, Larry B. WallnauPublisher:Cengage Learning
 Elementary Statistics: Picturing the World (7th E...StatisticsISBN:9780134683416Author:Ron Larson, Betsy FarberPublisher:PEARSON
 The Basic Practice of StatisticsStatisticsISBN:9781319042578Author:David S. Moore, William I. Notz, Michael A. FlignerPublisher:W. H. Freeman
 Introduction to the Practice of StatisticsStatisticsISBN:9781319013387Author:David S. Moore, George P. McCabe, Bruce A. CraigPublisher:W. H. Freeman

MATLAB: An Introduction with Applications
Statistics
ISBN:9781119256830
Author:Amos Gilat
Publisher:John Wiley & Sons Inc

Probability and Statistics for Engineering and th...
Statistics
ISBN:9781305251809
Author:Jay L. Devore
Publisher:Cengage Learning

Statistics for The Behavioral Sciences (MindTap C...
Statistics
ISBN:9781305504912
Author:Frederick J Gravetter, Larry B. Wallnau
Publisher:Cengage Learning

Elementary Statistics: Picturing the World (7th E...
Statistics
ISBN:9780134683416
Author:Ron Larson, Betsy Farber
Publisher:PEARSON

The Basic Practice of Statistics
Statistics
ISBN:9781319042578
Author:David S. Moore, William I. Notz, Michael A. Fligner
Publisher:W. H. Freeman

Introduction to the Practice of Statistics
Statistics
ISBN:9781319013387
Author:David S. Moore, George P. McCabe, Bruce A. Craig
Publisher:W. H. Freeman