A First Course in Probability (10th Edition)
10th Edition
ISBN: 9780134753119
Author: Sheldon Ross
Publisher: PEARSON
expand_more
expand_more
format_list_bulleted
Question
thumb_up100%

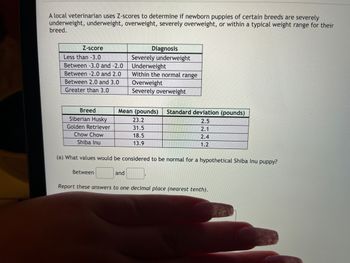
Transcribed Image Text:A local veterinarian uses Z-scores to determine if newborn puppies of certain breeds are severely
underweight, underweight, overweight, severely overweight, or within a typical weight range for their
breed.
Z-score
Less than -3.0
Between -3.0 and -2.0
Between -2.0 and 2.0
Between 2.0 and 3.0
Greater than 3.0
Breed
Siberian Husky
Golden Retriever
Chow Chow
Shiba Inu
Between
Diagnosis
Severely underweight
Underweight
Within the normal range
Overweight
Severely overweight
Mean (pounds) Standard deviation (pounds)
2.5
2.1
2.4
1.2
and
(a) What values would be considered to be normal for a hypothetical Shiba Inu puppy?
23.2
31.5
18.5
13.9
Report these answers to one decimal place (nearest tenth).
Expert Solution
This question has been solved!
Explore an expertly crafted, step-by-step solution for a thorough understanding of key concepts.
This is a popular solution
Trending nowThis is a popular solution!
Step by stepSolved in 3 steps

Knowledge Booster
Similar questions
- Insurance componies track life expertancy info to assist in determining the cost of life insurance polocies. The insurance compony knows that last year the life expectancy of its polocy holders was 77 years. They want to know if their clients this year have a longer life expectancy, on average, so the company randomy samples some of the recently paid polices to see if the mean life expectancy of polcy holders has increased. Sample: 86,75, 83, 84, 81, 77, 78, 79, 79,81, 76, 85, 70,76, 79,81, 73, 74, 72, 83. 1) Does this sample indicate that the insurance company should change its premiums because life expectancy has increased? 2) For more accurate cost determination, the insurance companies want to estimate the life expectancy to within one year with 95% confidence. How many randomly selected records would you need to have?arrow_forwardSuppose that a certain paper included the accompanying data on the tar level of cigarettes smoked for a sample of male smokers who died of lung cancer. Tar Level Frequency Low 108 Medium 383 High 568 Very high 155 Assume that the sample is representative of male smokers who die of lung cancer. Calculate the value of the ?2 test statistic that could be used to test whether the proportions of male smoker lung cancer deaths are not equal for all of the four tar level categories. The expected values are 303.5 for each of the four cells. (Round your answer to three decimal places.) ?2 =arrow_forwardWhen a person states at the outset of an experiment that a higher average score will be received by a group receiving some kind of treatment when it is compared to the mean of a group that did not receive the treatment, the need for a _________________ is apparent. a. one-tailed test b. two-tailed test c. an independent groups test d. a matched groups testarrow_forward
- Need help urgently pleasearrow_forwardUBS Wealth Management UK periodically ask their customers to evaluate their financial consultants and services. The higher the customer rating, the better the perceived service. The maximum rating is 7. Independent samples of two financial consultants are given below. Consultant A has 10 years' experience, Consultant B has 1 years' experience. Use α = 0.05 and test to see whether the consultant with more experience has the higher population mean service rating. Consultant A Consultant B N1 = 16 N2 = 10 Mean1 = 6.82 Mean2 = 6.25 S1= 0.64 S2 = 0.75 State the null and alternative hypothesis, Compute the value of the test statistic. What is the p-value? What is your conclusion?arrow_forwardA mean score of 136 is ____ SD below the mean for the smaller organization, and ____ SD below the mean for the larger organizationarrow_forward
- A study shows that 28% of the population has high blood pressure. The study also shows that 86% of those who do not have high blood pressure exercise at least 90 minutes per week, while 32% of those with high blood pressure exercise at least 90 minutes per week. Which of the following relative frequency tables could the study provide? Has high blood pressure Does not have high blood pressure Total Has high blood pressure Does not have high blood pressure Total Exercise > 90 minutes per week 24% 23% 47% Exercise > 90 minutes per week 9% 62% 71% Exercise < 90 minutes Total per week 4% 49% 53% 19% 10% 28% Exercise < 90 minutes Total per week 29% 72% 100% 28% 72% 100%arrow_forwardThe data for recent year showed the taxes and million dollars received from a random sample 10 states find the first and third quarters in the IQ are 31 5 20 36 33 13 11 26 30 28arrow_forwardDoes the type of instruction in a college statistics class (either lecture or self-paced) influence students’ performance, as measured by the number of quizzes successfully completed during the semester? Twelve students were recruited for the study. Students received the lecture instruction or a self-paced instruction. The total number of quizzes completed during teach type of instruction appear below.arrow_forward
arrow_back_ios
arrow_forward_ios
Recommended textbooks for you
 A First Course in Probability (10th Edition)ProbabilityISBN:9780134753119Author:Sheldon RossPublisher:PEARSON

A First Course in Probability (10th Edition)
Probability
ISBN:9780134753119
Author:Sheldon Ross
Publisher:PEARSON
