
MATLAB: An Introduction with Applications
6th Edition
ISBN: 9781119256830
Author: Amos Gilat
Publisher: John Wiley & Sons Inc
expand_more
expand_more
format_list_bulleted
Related questions
Question
| 4 | The estimated regression equation predicts that for each additional $1,000 income life insurance policy will rise by _______ ($1,000) | ||||||||
| a | 3.056 | ||||||||
| b | 3.820 | ||||||||
| c | 4.774 |
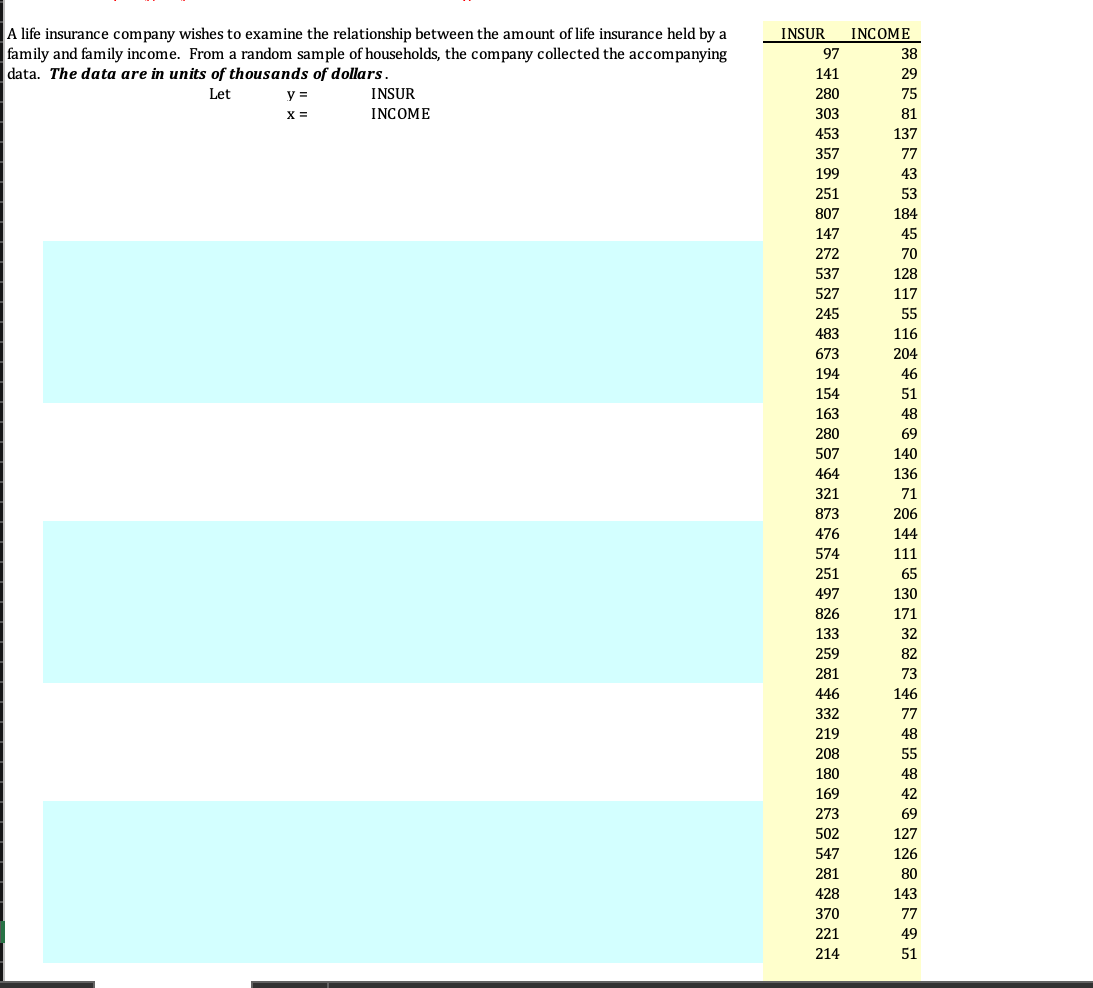

Transcribed Image Text:A life insurance company wishes to examine the relationship between the amount of life insurance held by a
family and family income. From a random sample of households, the company collected the accompanying
data. The data are in units of thousands of dollars.
INSUR
INCOME
97
38
141
29
Let
y =
INSUR
280
75
X3D
INCOME
303
81
453
137
357
77
199
43
251
53
807
184
147
45
272
70
537
128
527
117
245
55
483
116
673
204
194
46
154
51
163
48
280
69
507
140
464
136
321
71
873
206
476
144
574
111
251
65
497
130
826
171
133
32
259
82
281
73
446
146
332
77
219
48
208
55
180
48
169
42
273
69
502
127
547
126
281
80
428
143
370
77
221
49
214
51
Expert Solution
This question has been solved!
Explore an expertly crafted, step-by-step solution for a thorough understanding of key concepts.

This is a popular solution

Trending nowThis is a popular solution!

Step by stepSolved in 2 steps with 2 images

Knowledge Booster

Similar questions
- The table below shows the value, V, of an investment (in dollars) n years after 1992. 1 3 7 4120 4283 4919 12 14 5874 6050 n V(n) 6663 Use your calculator to determine the exponential regression equation that models the set of data above. Round the "a" value to the nearest whole number, and round the "b" value to three decimals. Use the indicated variables and proper function notation. V(n) Based on the your regression model, what is the percent increase per year? The value of this investment is increasing at a rate of % per year. Based the your regression model, what is value of this investment in the year 1992? Round your answer to the nearest dollar. The value of this investment is $ in the year 1992. Based on the your regression model, what is value of this investment in the year 2002? Round your answer to the nearest dollar. The value of this investment is S in the year 2002.arrow_forward2. Participants were kept awake for a certain number of hours before given a visuospatial task. Researchers measured how many correct responses each participant had. Results are shown below. Use alpha = .01. Number of Correct Hours Kept Awake (X) Responses (Y) 21 X = 10 SS, = 422 Y = 10 SS, = 690 2 4 19 %3D 6. 13 SPxy =-525 ху 5 20 S, =5.70 S, = 7.29 9. 11 10 9. 14 5 15 5 17 2 18 1 17 1 13 4 18 8 11 A. Graph the data. B. State the hypotheses. C. Make a decision about the null. a. Calculate Pearson's r i. Decision about null hypothesis? b. Calculate effect size i. Interpret effect size. D. State your conclusion. E. Relate your conclusion to the research. F. Calculate the regression formula. G. If someone was kept awake for 9 hours, what is the predicted number of correct responses?arrow_forward2arrow_forward
Recommended textbooks for you
- MATLAB: An Introduction with ApplicationsStatisticsISBN:9781119256830Author:Amos GilatPublisher:John Wiley & Sons Inc
 Probability and Statistics for Engineering and th...StatisticsISBN:9781305251809Author:Jay L. DevorePublisher:Cengage Learning
 Statistics for The Behavioral Sciences (MindTap C...StatisticsISBN:9781305504912Author:Frederick J Gravetter, Larry B. WallnauPublisher:Cengage Learning
  Elementary Statistics: Picturing the World (7th E...StatisticsISBN:9780134683416Author:Ron Larson, Betsy FarberPublisher:PEARSON
 The Basic Practice of StatisticsStatisticsISBN:9781319042578Author:David S. Moore, William I. Notz, Michael A. FlignerPublisher:W. H. Freeman
 Introduction to the Practice of StatisticsStatisticsISBN:9781319013387Author:David S. Moore, George P. McCabe, Bruce A. CraigPublisher:W. H. Freeman
MATLAB: An Introduction with Applications
Statistics
ISBN:9781119256830
Author:Amos Gilat
Publisher:John Wiley & Sons Inc
Probability and Statistics for Engineering and th...
Statistics
ISBN:9781305251809
Author:Jay L. Devore
Publisher:Cengage Learning
Statistics for The Behavioral Sciences (MindTap C...
Statistics
ISBN:9781305504912
Author:Frederick J Gravetter, Larry B. Wallnau
Publisher:Cengage Learning
Elementary Statistics: Picturing the World (7th E...
Statistics
ISBN:9780134683416
Author:Ron Larson, Betsy Farber
Publisher:PEARSON
The Basic Practice of Statistics
Statistics
ISBN:9781319042578
Author:David S. Moore, William I. Notz, Michael A. Fligner
Publisher:W. H. Freeman
Introduction to the Practice of Statistics
Statistics
ISBN:9781319013387
Author:David S. Moore, George P. McCabe, Bruce A. Craig
Publisher:W. H. Freeman