
MATLAB: An Introduction with Applications
6th Edition
ISBN: 9781119256830
Author: Amos Gilat
Publisher: John Wiley & Sons Inc
expand_more
expand_more
format_list_bulleted
Related questions
Question
A lecturer in a university wants to investigate the differences in students’ marks with the different majors from School A, School B, School C and School D for WSA1 subject. It was thought that students with four different majors might result in different grades for WSA1. The lecturer examined exam scores for a sample of four students each from the school that participated in the WSA1 class.
The following are the WSA1 exam results for the students:
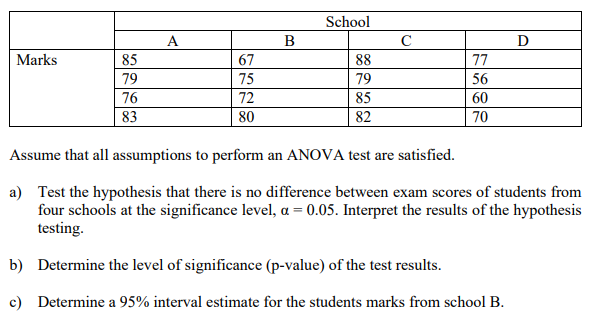

Transcribed Image Text:School
A
B
C
D
Marks
85
67
88
77
79
75
79
56
76
72
85
60
83
80
82
70
Assume that all assumptions to perform an ANOVA test are satisfied.
a) Test the hypothesis that there is no difference between exam scores of students from
four schools at the significance level, a = 0.05. Interpret the results of the hypothesis
testing.
b) Determine the level of significance (p-value) of the test results.
c) Determine a 95% interval estimate for the students marks from school B.
Expert Solution
This question has been solved!
Explore an expertly crafted, step-by-step solution for a thorough understanding of key concepts.

Step by stepSolved in 2 steps with 2 images

Knowledge Booster

Similar questions
- Nationally, 61% of American own American cars, 26% of Americans own Asian cars, and the remaing Americans own non-Asian foreign cars. A survey of 205 people in California finds that 54% own American cars, 31% own Asian cars, and the remaining own non-Asian foreign cars. When testing (at the 10% level of significance) whether the proportions in California are the same as the national proportions, what is the test statistic (please round your answer to 3 decimal places)arrow_forwardIf a hurricane was headed your way, would you evacuate? The headline of a press release states, "Thirty-two Percent of People on High-Risk Coast Will Refuse Evacuation Order, Survey of Hurricane Preparedness Finds." This headline was based on a survey of 4,625 adults who live within 20 miles of the coast in high hurricane risk counties of eight southern states. In selecting the sample, care was taken to ensure that the sample would be representative of the population of coastal residents in these states. In USE SALT (a) Use this information to estimate the proportion of coastal residents who would evacuate using a 98% confidence interval. (Round your answers to three decimal places.) (b) Write a few sentences interpreting the interval and the confidence level associated with the interval. We are % confident that the proportion of all coastal residents who -Select-- v evacuate is within the confidence interval. If we were to take a large number of random samples of size 4,625, % of the…arrow_forwardThere are 25 students in Mr. Williamson's statistics class. On a cold winter day in February, many of the students had runny noses and sore throats. After examining each student, the collage's health center found the following rarrow_forward
- A marketing agency wanted to determine if a new commercial changed people's opinion about a company. They recruited n=30 participants to watch the commercial. First, everyone was givien a survey to determine their attitudes toward the company. Then, everyone watched the new commercial. Finally, they were given the same survey again and asked about their attitudes toward the comapny after seeing the commercial. The agency wanted to see if attitudes were changed by the commercial. What statistical test should they use?arrow_forwardA psychologist wanted to know if students in her class were more likely to cheat if they were low achievers. She divided her 60 students into three groups (low, middle, and high) based on their mean exam score on the previous three tests. She then asked them to rate how likely they were to cheat on an exam if the opportunity presented itself with a very limited chance for consequences. The students rated their desire to cheat on a scale ranging from 1-100, with lower numbers indicating less desire to cheat. Before opening the data, what would you hypothesize about this research question? Open the data set. Before running any statistical analyses, glance through the data. Do you think that your hypothesis will be supported? Conduct descriptive analyses and report them here. Conduct a one-way ANOVA. Report your statistical findings (including any applicable tables in APA format) here. What would you conclude from this analysis? What would be your next steps, if this…arrow_forwardCarlos is a very hard-working student who studies every night for at least one hour. His favorite subject is mathematics. He knows that his grade for each marking period is determined by a weight of 50% for all daily work and 50% for major grades, such as, tests, projects and quizzes. He received the following test grades for mathematics during the fourth marking period: 89, 78, 90, 81, 95, and 90. What was his mean mathematics test grade rounded to the nearest whole number? O 90 O 87 O 77 O 93 O O Oarrow_forward
- In a One-way Between Subject ANOVA, the number of levels the IV had was 3, and the within/error degrees of freedom was 48. What was the total number of people in the participants analyzed in the studyarrow_forwardThe College Board provided comparisons of Scholastic Aptitude Test (SAT) scores based on the highest level of education attained by the test taker's parents. A research hypothesis was that students whose parents had attained a higher level of education would on average score higher on the SAT. The overall mean SAT math score was 514. SAT math scores for independent samples of students follow. The first sample shows the SAT math test scores for students whose parents are college graduates with a bachelor's degree. The second sample shows the SAT math test scores for students whose parents are high school graduates but do not have a college degree. College Grads 485 487 518 517 650 542 570 426 566 499 588 562 497 448 592 453 High School Grads 442 492 580 478 479 425 486 485 528 390 524 535 (b) What is the point estimate of the difference between the means for the two populations? (c) Find the value of the test statistic. (Round your answer…arrow_forwardA vaccine to prevent a severe virus was given to children within the first year of life as part of a drug study. The study reported that of the 3456bchildren randomly assigned the vaccine, 58 got the virus. Of the 1606 children randomly assigned the placebo, 46 got the virus. a. Find the sample percentage of children who caught the virus in each group. Is the sample percentage lower for the vaccine group, as investigators hoped? b. Determine whether the vaccine is effective in reducing the chance of catching the virus, using a significance level of 0.01.The first few steps of the hypothesis-testing procedure are given. Complete the procedure.arrow_forward
- A television station broadcasts a court trial in its entirety. During a news program, viewers were asked to go to the TV station’s website and state whether they thought the defendant was guilty or not guilty. Of the 1840 viewers who gave their opinion, 1521 felt that the defendant was not guilty. The viewers who registered their opinions constitute what typeof sample?arrow_forwardAccording the the U.S. Census bureau, the percentage of Santa Ana residents with a bachelor's degree or higher is 14% and the percentage of Irvine residents with a bachelor's degree or higher is 68.5%. Suppose that the sample sizes were 1000 for the Santa Ana group and 1000 for the irvine group. Is there enough evidence to conclude that people who live in Irvine have a higher level of education compared to people living in Santa Ana?arrow_forwardAccording to the Humane Society, 33% of households in the United States own at least one cat. You are interested in determining whether the proportion of households of the students at your school that own at least one cat is different from the national proportion. Suppose you survey an SRS of students at your school and find that 25% of them own cats, which yields a p-value of .092. Interpret this p-value.arrow_forward
arrow_back_ios
SEE MORE QUESTIONS
arrow_forward_ios
Recommended textbooks for you
- MATLAB: An Introduction with ApplicationsStatisticsISBN:9781119256830Author:Amos GilatPublisher:John Wiley & Sons Inc
 Probability and Statistics for Engineering and th...StatisticsISBN:9781305251809Author:Jay L. DevorePublisher:Cengage Learning
 Statistics for The Behavioral Sciences (MindTap C...StatisticsISBN:9781305504912Author:Frederick J Gravetter, Larry B. WallnauPublisher:Cengage Learning
  Elementary Statistics: Picturing the World (7th E...StatisticsISBN:9780134683416Author:Ron Larson, Betsy FarberPublisher:PEARSON
 The Basic Practice of StatisticsStatisticsISBN:9781319042578Author:David S. Moore, William I. Notz, Michael A. FlignerPublisher:W. H. Freeman
 Introduction to the Practice of StatisticsStatisticsISBN:9781319013387Author:David S. Moore, George P. McCabe, Bruce A. CraigPublisher:W. H. Freeman
MATLAB: An Introduction with Applications
Statistics
ISBN:9781119256830
Author:Amos Gilat
Publisher:John Wiley & Sons Inc
Probability and Statistics for Engineering and th...
Statistics
ISBN:9781305251809
Author:Jay L. Devore
Publisher:Cengage Learning
Statistics for The Behavioral Sciences (MindTap C...
Statistics
ISBN:9781305504912
Author:Frederick J Gravetter, Larry B. Wallnau
Publisher:Cengage Learning
Elementary Statistics: Picturing the World (7th E...
Statistics
ISBN:9780134683416
Author:Ron Larson, Betsy Farber
Publisher:PEARSON
The Basic Practice of Statistics
Statistics
ISBN:9781319042578
Author:David S. Moore, William I. Notz, Michael A. Fligner
Publisher:W. H. Freeman
Introduction to the Practice of Statistics
Statistics
ISBN:9781319013387
Author:David S. Moore, George P. McCabe, Bruce A. Craig
Publisher:W. H. Freeman