
MATLAB: An Introduction with Applications
6th Edition
ISBN: 9781119256830
Author: Amos Gilat
Publisher: John Wiley & Sons Inc
expand_more
expand_more
format_list_bulleted
Related questions
Question
- A large chemistry course took their final exam. The
mean was 75 with a standard deviation of 8.- What are the exam scores that separate the top and bottom 5 percent of the class (extreme 10%)
2. What are the exams scores that separate the middle 10% of the class (5% on each side of the mean)?
Use table below and draw
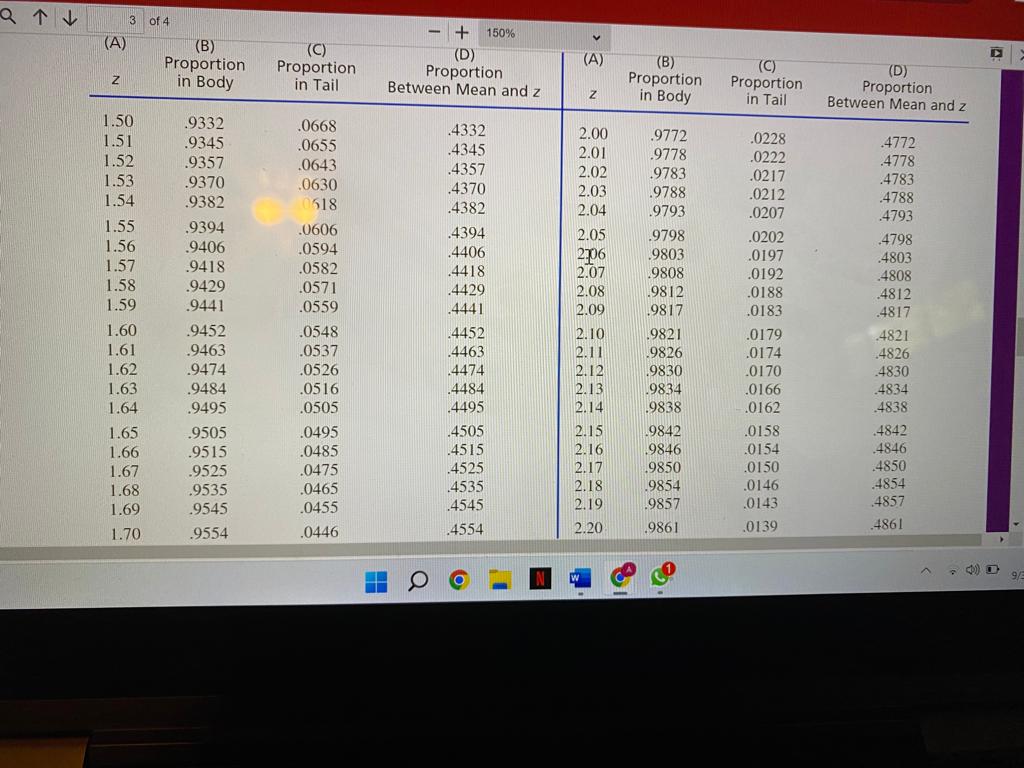

Transcribed Image Text:2↑↓
(A)
Z
3
1.50
1.51
1.52
1.53
1.54
1.55
1.56
1.57
1.58
1.59
1.60
1.61
1.62
1.63
1.64
1.65
1.66
1.67
1.68
1.69
1.70
of 4
(B)
Proportion
in Body
.9332
.9345
.9357
.9370
.9382
.9394
.9406
.9418
.9429
.9441
9452
.9463
.9474
.9484
.9495
.9505
.9515
.9525
.9535
.9545
.9554
(C)
Proportion
in Tail
.0668
.0655
.0643
.0630
0618
.0606
.0594
.0582
.0571
.0559
.0548
.0537
.0526
.0516
.0505
.0495
.0485
.0475
.0465
.0455
.0446
-
(D)
Proportion
Between Mean and z
.4332
.4345
.4357
.4370
.4382
150%
.4394
.4406
4418
4429
.4441
4452
.4463
4474
.4484
4495
4505
.4515
4525
4535
4545
4554
(A)
N
2.00
2.01
2.02
2.03
2.04
2.05
2706
2.07
2.08
2.09
2.10
2.11
2.12
2.13
2.14
2.15
2.16
2.17
2.18
2.19
2.20
(B)
Proportion
in Body
.9772
.9778
.9783
9788
.9793
.9798
9803
.9808
9812
9817
.9821
.9826
.9830
9834
9838
.9842
9846
9850
.9854
9857
.9861
3
(C)
Proportion
in Tail
.0228
0222
.0217
.0212
.0207
.0202
.0197
.0192
.0188
.0183
.0179
.0174
.0170
.0166
.0162
.0158
.0154
.0150
.0146
.0143
.0139
(D)
Proportion
Between Mean and z
4772
4778
.4783
4788
4793
4798
.4803
4808
4812
4817
4821
.4826
4830
.4834
4838
.4842
.4846
.4850
4854
4857
.4861
A

Transcribed Image Text:1.70
1.71
1.72
1.73
1.74
1.75
1.76
1.77
1.78
1.79
1.80
1.81
1.82
1.83
1.84
1.85
1.86
1.87
1.88
1.89
1.90
1.91
1.92
1.93
1.94
9554
.9564
.9573
.9582
.9591
.9599
.9608
.9616
.9625
.9633
.9641
.9649
.9656
.9664
.9671
.9678
.9686
.9693
.9699
.9706
.9713
.9719
.9726
.9732
.9738
.0446
.0436
.0427
.0418
.0409
.0401
.0392
.0384
.0375
0367
.0359
.0351
.0344
.0336
.0329
.0322
.0314
.0307
.0301
.0294
.0287
.0281
.0274
.0268
.0262
H
+ 150%
4554
.4564
.4573
.4582
.4591
.4599
.4608
.4616
.4625
.4633
.4641
.4649
.4656
.4664
.4671
.4678
4686
.4693
.4699
.4706
4713
.4719
.4726
4732
4738
2.20
2.21
2.22
2.23
2.24
2.25
2.26
2.27
2.28
2.29
2.30
2.31
32
2.33
2.34
2.35
2.36
2.37
2.38
2.39
2.40
2.41
2.42
2.43
2.44
.9861
.9864
.9868
.9871
.9875
.9878
.9881
.9884
.9887
.9890
.9893
.9896
9898
.9901
.9904
.9906
.9909
9911
9913
.9916
.9918
.9920
.9922
.9925
.9927
.0139
.0136
.0132
.0129
.0125
.0122
.0119
.0116
.0113
.0110
.0107
.0104
.0102
.0099
.0096
.0094
.0091
.0089
.0087
.0084
.0082
.0080
.0078
.0075
.0073
4861
4864
4868
4871
4875
.4878
.4881
4884
4887
.4890
.4893
.4896
.4898
.4901
.4904
.4906
.4909
4911
.4913
.4916
.4918
.4920
4922
.4925
.4927
D
今日
Expert Solution
This question has been solved!
Explore an expertly crafted, step-by-step solution for a thorough understanding of key concepts.

This is a popular solution

Trending nowThis is a popular solution!

Step by stepSolved in 3 steps with 3 images

Knowledge Booster

Similar questions
- Find the mean absolute deviation of the data below 10,15,9,8,7,11,14,8,10,12arrow_forwardWhich data set would be likely to have the larger standard deviation? Explain. * * Data set 1: Weights of all dogs at a golden retriever rescue shelter * Data set 2: Weights of all dogs for sale in a pet shop.arrow_forwardIf the number of degrees of freedom for a chi-square distribution is 32, Determine the population mean and standard deviation. Please explain how you derived the answerarrow_forward
- National park services, a bureau of the US government responsible for park management, is interested in how the scores of their park rangers today are better or worse than in the past. The cognitive test that the forest rangers take as remained the same over the last five years. Below are the scores for each year, compute the mean, median, mode, range, and standard deviation for each year. Current Year 56, 45, 64, 75, 87, 81, 69, 81, 58, 92, 99, 95, 75, 92, 73, 83, 47, 69, 57, 74, 62, 74, 73, 100, 83 Five Years Ago 66, 78, 75, 79, 59, 74, 55, 89, 55, 79, 68, 27, 69, 95, 68, 90, 65, 79, 69, 79, 87, 86, 98, 81, 96arrow_forwardplease use one or two variable analysisarrow_forwardWhat raw score is needed to be in the top 8%? Mean is 90Standard Deviation is 7.8arrow_forward
- O As part of his workout routine, Jim swim's 50m several times per session. His times follow a normal distribution with a mean of 45 seconds with a standard deviation of 1.8 seconds. What percent of his times would he expect to be between 42 and 48 seconds?arrow_forwardThe sample mean amount of savings is $arrow_forwardboulder 10k race was 1.78 standard deviations faster than women's average group. 405 women ran , assuming normal distribution, how many women ran faster than joan?arrow_forward
arrow_back_ios
SEE MORE QUESTIONS
arrow_forward_ios
Recommended textbooks for you
- MATLAB: An Introduction with ApplicationsStatisticsISBN:9781119256830Author:Amos GilatPublisher:John Wiley & Sons Inc
 Probability and Statistics for Engineering and th...StatisticsISBN:9781305251809Author:Jay L. DevorePublisher:Cengage Learning
 Statistics for The Behavioral Sciences (MindTap C...StatisticsISBN:9781305504912Author:Frederick J Gravetter, Larry B. WallnauPublisher:Cengage Learning
  Elementary Statistics: Picturing the World (7th E...StatisticsISBN:9780134683416Author:Ron Larson, Betsy FarberPublisher:PEARSON
 The Basic Practice of StatisticsStatisticsISBN:9781319042578Author:David S. Moore, William I. Notz, Michael A. FlignerPublisher:W. H. Freeman
 Introduction to the Practice of StatisticsStatisticsISBN:9781319013387Author:David S. Moore, George P. McCabe, Bruce A. CraigPublisher:W. H. Freeman
MATLAB: An Introduction with Applications
Statistics
ISBN:9781119256830
Author:Amos Gilat
Publisher:John Wiley & Sons Inc
Probability and Statistics for Engineering and th...
Statistics
ISBN:9781305251809
Author:Jay L. Devore
Publisher:Cengage Learning
Statistics for The Behavioral Sciences (MindTap C...
Statistics
ISBN:9781305504912
Author:Frederick J Gravetter, Larry B. Wallnau
Publisher:Cengage Learning
Elementary Statistics: Picturing the World (7th E...
Statistics
ISBN:9780134683416
Author:Ron Larson, Betsy Farber
Publisher:PEARSON
The Basic Practice of Statistics
Statistics
ISBN:9781319042578
Author:David S. Moore, William I. Notz, Michael A. Fligner
Publisher:W. H. Freeman
Introduction to the Practice of Statistics
Statistics
ISBN:9781319013387
Author:David S. Moore, George P. McCabe, Bruce A. Craig
Publisher:W. H. Freeman