
MATLAB: An Introduction with Applications
6th Edition
ISBN: 9781119256830
Author: Amos Gilat
Publisher: John Wiley & Sons Inc
expand_more
expand_more
format_list_bulleted
Related questions
Concept explainers
Topic Video
Question
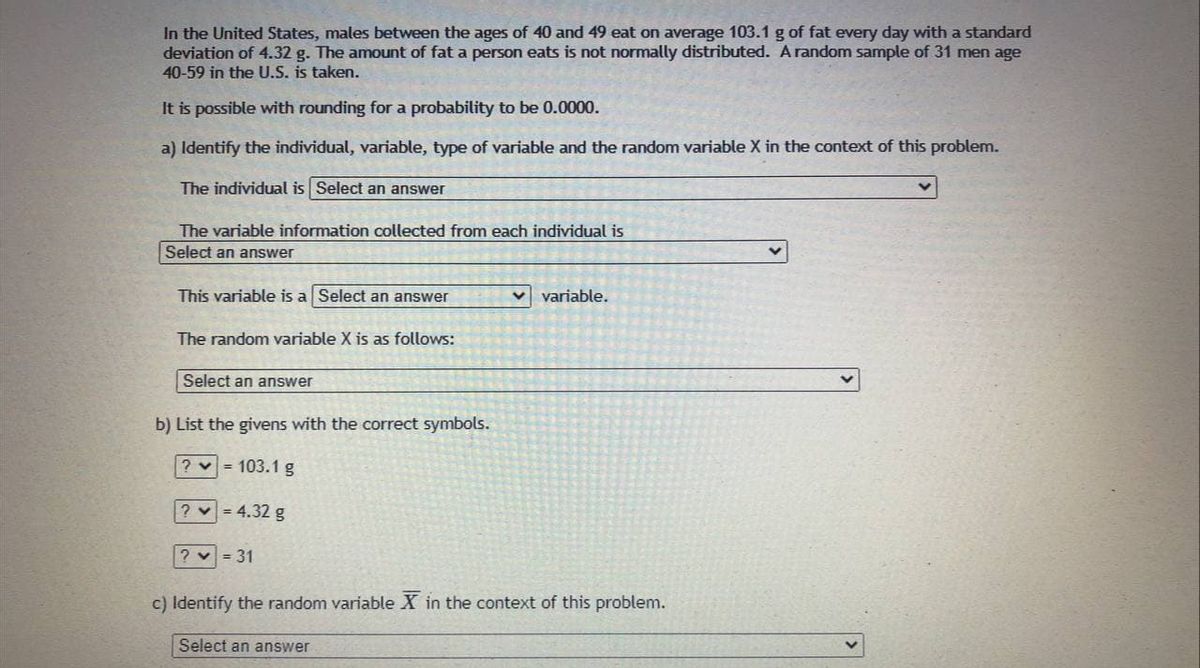

Transcribed Image Text:In the United States, males between the ages of 40 and 49 eat on average 103.1 g of fat every day with a standard
deviation of 4.32 g. The amount of fat a person eats is not normally distributed. A random sample of 31 men age
40-59 in the U.S. is taken.
It is possible with rounding for a probability to be 0.0000.
a) Identify the individual, variable, type of variable and the random variable X in the context of this problem.
The individual is Select an answer
The variable information collected from each individual is
Select an answer
This variable is a Select an answer
v variable.
The random variable X is as follows:
Select an answer
b) List the givens with the correct symbols.
? v = 103.1 g
? = 4.32 g
? v = 31
c) Identify the random variable X
the context of this problem.
Select an answer

Transcribed Image Text:.com
d) Find the mean of the sampling distribution of the sample mean.
Put the numeric value in the first box and the correct units in the second box.
e) Find the standard deviation of the sampling distribution of the sample mean.
Put the numeric value rounded to two decimal places in the first box and the correct units in the second box.
f) What is the shape of the sampling distribution of the sample mean?
Select an answer
Why? Check all that apply:
On is at least 30
population is normal
On is less than 30
Oo is known
Upopulation is not normal
Do is unknown
Expert Solution
This question has been solved!
Explore an expertly crafted, step-by-step solution for a thorough understanding of key concepts.

This is a popular solution

Trending nowThis is a popular solution!

Step by stepSolved in 2 steps

Knowledge Booster


Learn more about
Need a deep-dive on the concept behind this application? Look no further. Learn more about this topic, statistics and related others by exploring similar questions and additional content below.Similar questions
- A test was given to a group of students. The grades and gender are summarized below A B 0 Total Male 16 6 14 36 Female 3 20 10 33 Total 19 26 69 If one student is chosen at random from those who took the test, Find the probability that the student was male GIVEN they got an 'A'. Round answer 4 places after the decimal if needed. Question Help: Video Message instructor Submit Question Type here to search Et F5 F1 Esc ! 1 F2 2 F3 W D) # 3 F4 E O Ox $ 4 R ☆ соро % F6 5 T e F7 N 6 LL F8 & TY 7arrow_forwardThe CDC did a study on various ways to quit smoking. The results of the study are shown below. Nicotine Gum Nicotine Patch Nicotine Inhaler Still Smoking 191 263 95 Quit Smoking 59 57 27 Suppose a person in the study is chosen randomly. What is the probability that the person was still smoking given that they used the nicotine gum? T T T Arialarrow_forwardGiving a test to a group of students, the grades and gender are summarized below A B C Total Male 17 8 5 30 Female 10 4 11 25 Total 27 12 16 55 If one student is chosen at random, Find the probability that the student was female: Find the probability that the student was female AND got a "A": Find the probability that the student was female OR got a "A": If one student is chosen at random, find the probability that the student was female GIVEN they got a 'A':arrow_forward
- What is assigned randomly?arrow_forwardA test was given to a group of students. The grades and gender are summarized below A B C Total Male 15 2 9 26 Female 5 20 7 32 Total 20 22 16 58 If one student is chosen at random from those who took the test,Find the probability that the student was female GIVEN they got an 'A'.arrow_forwardYou are doing research on balance and fitness. To complete this research you will need a watch with a second hand. Identify a random sample of n = 12 men and n = 8 women. You must answer this question: How do you establish that this sample is truly random? Have each subject perform the following task: Have the subjects stand with their hands at their side, raise one knee, cross their ankle over the other knee, squat and bring their hands palms together in front of their chest. Time the subject until they put their foot back down on the floor. b) Ask the following questions: i) How many days per week do they exercise? ii) What is their favorite exercise? You will analyze your data and compute the following statistics for each group: 1) The Mean and standard deviation of the number of seconds the subject stayed balanced 2) The Median number of days per week exercised 3) The Mode of the favorite exercise 4) The 90% confidence interval of the mean Construct a complete…arrow_forward
- a. The population Proportion p=? b. The sample proportion is? c.Find the standard error?arrow_forward. A sample of 200 people was asked their favorite genre of music. Below are the results. Gender Rock Pop Hip-Hop Other Male 31 20 37 12 Female 17 30 19 34 If one of those people is randomly selected, find the probability that the person is a female or their favorite genre of music is Hip-hop. Round to three decimal places as needed. If one of those people is random selected, find the probability that the person’s favorite genre of music is Pop, given that the person is a male. Round to three decimal places as needed.arrow_forward
arrow_back_ios
arrow_forward_ios
Recommended textbooks for you
- MATLAB: An Introduction with ApplicationsStatisticsISBN:9781119256830Author:Amos GilatPublisher:John Wiley & Sons Inc
 Probability and Statistics for Engineering and th...StatisticsISBN:9781305251809Author:Jay L. DevorePublisher:Cengage Learning
 Statistics for The Behavioral Sciences (MindTap C...StatisticsISBN:9781305504912Author:Frederick J Gravetter, Larry B. WallnauPublisher:Cengage Learning
  Elementary Statistics: Picturing the World (7th E...StatisticsISBN:9780134683416Author:Ron Larson, Betsy FarberPublisher:PEARSON
 The Basic Practice of StatisticsStatisticsISBN:9781319042578Author:David S. Moore, William I. Notz, Michael A. FlignerPublisher:W. H. Freeman
 Introduction to the Practice of StatisticsStatisticsISBN:9781319013387Author:David S. Moore, George P. McCabe, Bruce A. CraigPublisher:W. H. Freeman
MATLAB: An Introduction with Applications
Statistics
ISBN:9781119256830
Author:Amos Gilat
Publisher:John Wiley & Sons Inc
Probability and Statistics for Engineering and th...
Statistics
ISBN:9781305251809
Author:Jay L. Devore
Publisher:Cengage Learning
Statistics for The Behavioral Sciences (MindTap C...
Statistics
ISBN:9781305504912
Author:Frederick J Gravetter, Larry B. Wallnau
Publisher:Cengage Learning
Elementary Statistics: Picturing the World (7th E...
Statistics
ISBN:9780134683416
Author:Ron Larson, Betsy Farber
Publisher:PEARSON
The Basic Practice of Statistics
Statistics
ISBN:9781319042578
Author:David S. Moore, William I. Notz, Michael A. Fligner
Publisher:W. H. Freeman
Introduction to the Practice of Statistics
Statistics
ISBN:9781319013387
Author:David S. Moore, George P. McCabe, Bruce A. Craig
Publisher:W. H. Freeman