MATLAB: An Introduction with Applications
6th Edition
ISBN: 9781119256830
Author: Amos Gilat
Publisher: John Wiley & Sons Inc
expand_more
expand_more
format_list_bulleted
Concept explainers
Question

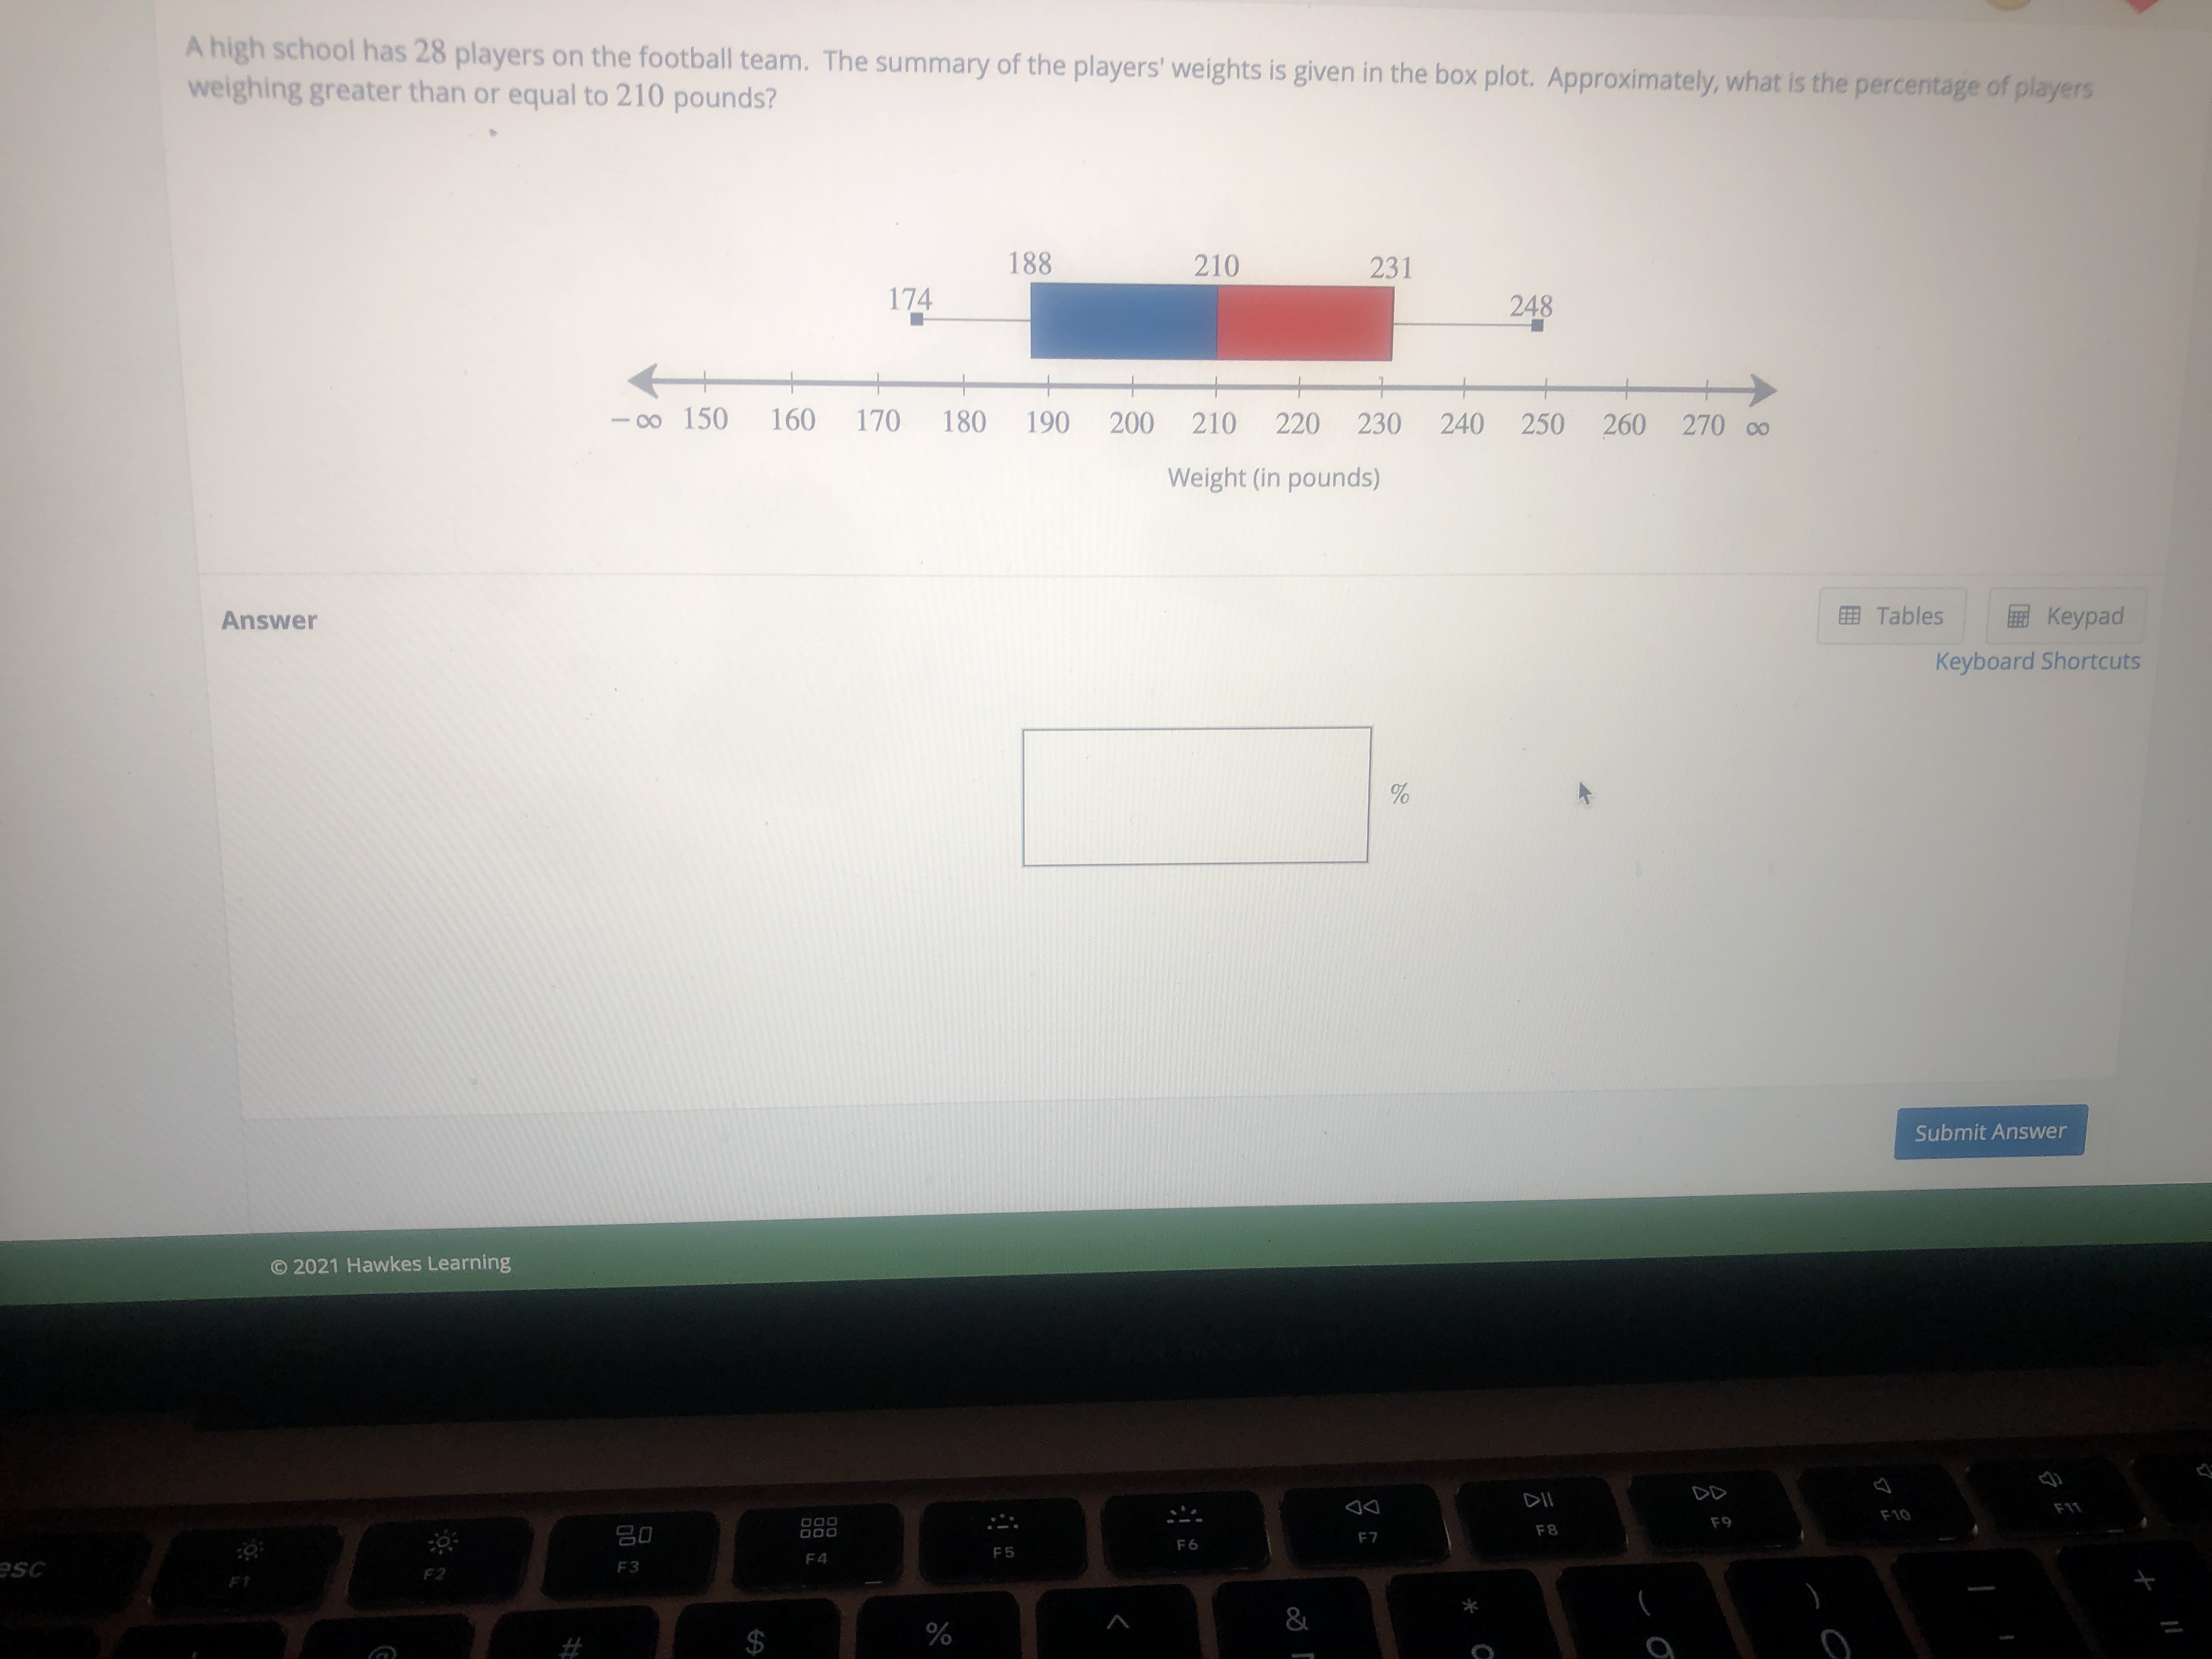
Transcribed Image Text:A high school has 28 players on the football team. The summary of the players' weights is given in the box plot. Approximately, what is the percentage of players
weighing greater than or equal to 210 pounds?
188
210
231
174
248
- 0o 150
160
170
180
190
200
210
220
230
240
250
260
270 00
Weight (in pounds)
Expert Solution
This question has been solved!
Explore an expertly crafted, step-by-step solution for a thorough understanding of key concepts.
This is a popular solution
Trending nowThis is a popular solution!
Step by stepSolved in 2 steps

Knowledge Booster
Learn more about
Need a deep-dive on the concept behind this application? Look no further. Learn more about this topic, statistics and related others by exploring similar questions and additional content below.Similar questions
- The ages (in years) and helghts (in inches) of all pitchers for a beseball team are listed. Find the coefficient of variation for each of the two data sets. Then compare the results. -Click the Icon to view the data sets. CV. %D Round to one decimal place as needed.)arrow_forwardA = 11 B = 2 C= 2 D = 0 F = 1 105, 82, 94.5, 72.5, 92, 91, 52, 86, 100, 96, 98, 109, 96, 98, 95, 72arrow_forwardThe value of a certain car when it was brand new with 0 mileage was $17,000 but the value dropped to $4,000 when the car acounulated 80,000 miles shown in the scatter plot below. Car's Mleage and Value S17.000 $2,000 Mileage Based on the data in the scatter plot, at what mileage was the car worth about $12,000? O 20,000 miles O 30,000 miles O 60,000 miles O 80,000 milesarrow_forward
- Use a stem-and-leaf plot to display the data, which represent the numbers of hours 24 nurses work per week. Describe any patterns. 40 40 44 48 38 40 36 50 32 36 40 35 30 26 40 36 40 36 40 33 40 32 38 29 Determine the leaves in the stem-and-leaf plot below. Key: 313 = 33 Hours worked What best describes the data? O A. Most nurses work between 40 and 50 hours per week, inclusive. O B. Most nurses work between 30 and 40 hours per week, inclusive. OC. Most nurses work over 40 hours per week. O D. Most nurses work under 40 hours per week. 0arrow_forwardThere are 9 girls and 12 boys in the classroom. What percentage of the classroom are girls? A. 75%B. 133%C. 42.8%arrow_forwardThis stem and leaf plot shows the height of several trees. Height in Feet and Inches of Several Trees 5 0,0,2,4,4,4,7 6 5,6 7 0,1,1,8,11 85 What is the number of trees that are LESS than 7 feet tall?arrow_forward
- The ages (in years) and heights (in inches) of all pitchers for a baseball team are listed. Find the coefficient of variation for each of the two data sets. Then compare the results. heights Ages 73 28 76 22 74 23 72 24 77 24 78 27 76 31 79 28 73 27 78 35 74 33 79 36arrow_forwardAn advertising firm has decided to ask 98 customers at each of four local shopping malls if they are willing to take part in a market research survey. At αα = 0.05 is there evidence to show that the proportions are not all the same. A B C D Willing 69 65 68 70 Not Willing 29 33 30 28 What are the expected numbers? (round to 3 decimal places) A B C D Willing Not Willing The hypotheses are H0:pA=pB=pC=pDH0:pA=pB=pC=pD HA:HA: At least one of the proportions is different. (claim) Since αα = 0.05 the critical value is 7.815 The test value is: (round to 3 decimal places) The p-value is (round to 3 decimal places) So the decision is to do not reject H0H0 reject H0H0 Thus the final conclusion is There is not enough evidence to support the claim that at least one of the proportions is different. There is not enough evidence to reject the claim that at least one of the proportions is different. There is enough evidence to reject the claim…arrow_forward2. V = % Bh (B = ?, V = 189, h 9)arrow_forward
arrow_back_ios
SEE MORE QUESTIONS
arrow_forward_ios
Recommended textbooks for you
 MATLAB: An Introduction with ApplicationsStatisticsISBN:9781119256830Author:Amos GilatPublisher:John Wiley & Sons Inc
 Probability and Statistics for Engineering and th...StatisticsISBN:9781305251809Author:Jay L. DevorePublisher:Cengage Learning
 Statistics for The Behavioral Sciences (MindTap C...StatisticsISBN:9781305504912Author:Frederick J Gravetter, Larry B. WallnauPublisher:Cengage Learning
 Elementary Statistics: Picturing the World (7th E...StatisticsISBN:9780134683416Author:Ron Larson, Betsy FarberPublisher:PEARSON
 The Basic Practice of StatisticsStatisticsISBN:9781319042578Author:David S. Moore, William I. Notz, Michael A. FlignerPublisher:W. H. Freeman
 Introduction to the Practice of StatisticsStatisticsISBN:9781319013387Author:David S. Moore, George P. McCabe, Bruce A. CraigPublisher:W. H. Freeman

MATLAB: An Introduction with Applications
Statistics
ISBN:9781119256830
Author:Amos Gilat
Publisher:John Wiley & Sons Inc

Probability and Statistics for Engineering and th...
Statistics
ISBN:9781305251809
Author:Jay L. Devore
Publisher:Cengage Learning

Statistics for The Behavioral Sciences (MindTap C...
Statistics
ISBN:9781305504912
Author:Frederick J Gravetter, Larry B. Wallnau
Publisher:Cengage Learning

Elementary Statistics: Picturing the World (7th E...
Statistics
ISBN:9780134683416
Author:Ron Larson, Betsy Farber
Publisher:PEARSON

The Basic Practice of Statistics
Statistics
ISBN:9781319042578
Author:David S. Moore, William I. Notz, Michael A. Fligner
Publisher:W. H. Freeman

Introduction to the Practice of Statistics
Statistics
ISBN:9781319013387
Author:David S. Moore, George P. McCabe, Bruce A. Craig
Publisher:W. H. Freeman