
MATLAB: An Introduction with Applications
6th Edition
ISBN: 9781119256830
Author: Amos Gilat
Publisher: John Wiley & Sons Inc
expand_more
expand_more
format_list_bulleted
Related questions
Question
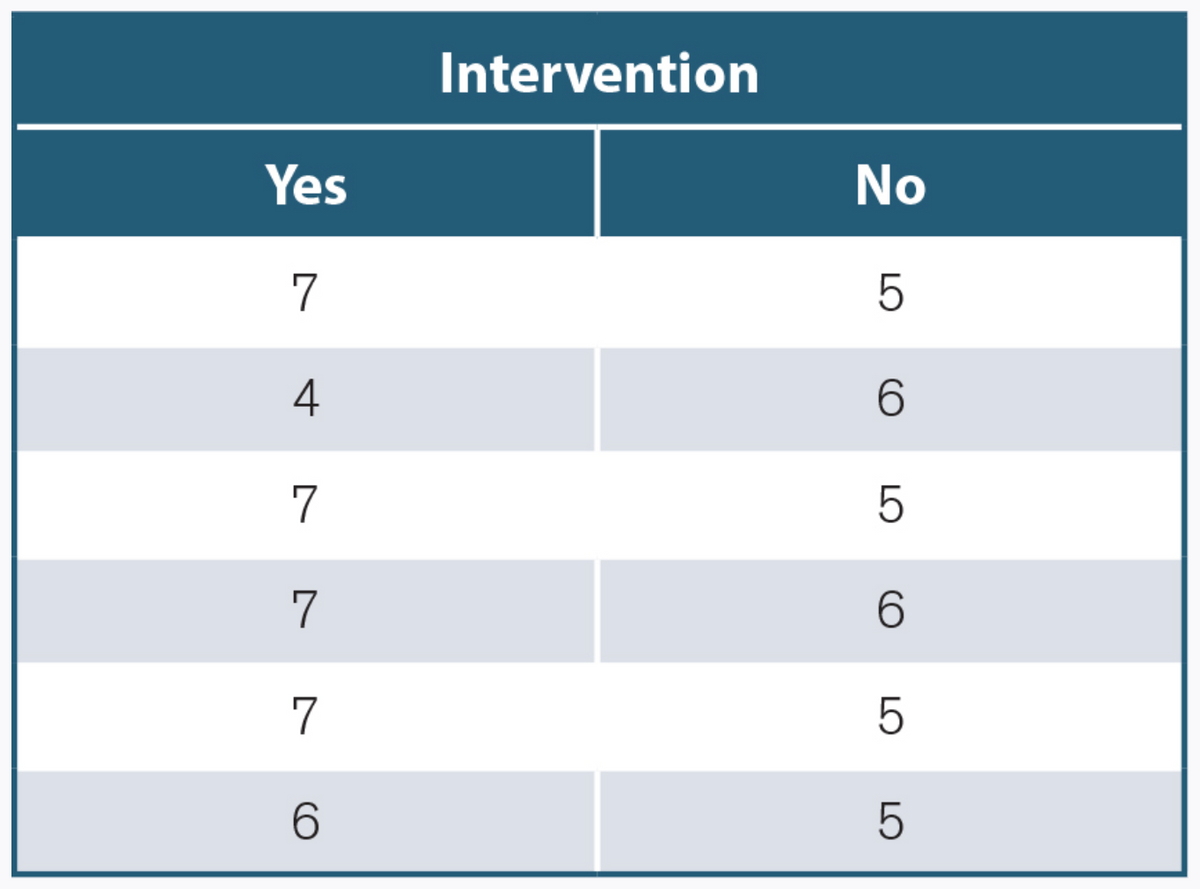
- A health psychologist tests a new intervention to determine if it can change healthy behaviors among children. To conduct the test, the researcher gives one group of children an intervention, and a second group is given a control task without the intervention. The number of healthy behaviors observed in the children during a 5-minute observation are given in the table. Use the following data to answer the questions.}
NOTE: The problem doesn't say this, but because this is a chapter on related samples t tests, you can assume that a child in the intervention group is matched to a particular child in the control group.
Calculate the difference scores. Use D = Yes - No.
List the difference scores. (for example, x, x, -x, etc.) (whole numbers)
_________
Calculate the mean of the difference scores. (whole number) MD =
_________

Transcribed Image Text:Intervention
Yes
No
7
4
6.
7
7
6.
7
6.
LO
LO
LO
LO
Expert Solution
This question has been solved!
Explore an expertly crafted, step-by-step solution for a thorough understanding of key concepts.

This is a popular solution

Trending nowThis is a popular solution!

Step by stepSolved in 2 steps with 2 images

Knowledge Booster

Similar questions
- Please answer all sub-parts Clinical trials involved treating patients with Tamiflu, which is a medicine intended to attack the influenza virus and stop it from causing flu symptoms. Among 724 patients treated with Tamiflu, 72 experienced nausea as an adverse reaction. Use a significance level of 0.05 to test the claim that the rate of nausea experienced by patients who were given Tamiflu is higher than the 6% rate experienced by flu patients who were given a placebo.arrow_forward*Please do in Excel A clinical trial is conducted to compare an experimental medication to placebo to reduce the symptoms of asthma. Two hundred participants are enrolled in the study and randomized to receive either the experimental medication or placebo. The primary outcome is self-reported reduction of symptoms. Among 100 participants who receive the experimental medication, 38 report a reduction of symptoms as compared to 21 participants of 100 assigned to placebo. Test if there is a significant difference in the proportions of participants reporting a reduction of symptoms between the experimental and placebo groups. Use alpha=0.05.arrow_forwardQUESTION 3 A wholesaler must decide how many computers to purchase before they know how many they will be able to sell to local retailers. The wholesaler purchases the computers for S300 each and sells them to retailers for $350 each. If the wholesaler is not able to sell them to a retailer then the wholesaler can return them to the manufacturer (for a refund of the S300 cost), but the wholesaler must pay $40 per computer that it returns to the manufacturer (in shipping, handling, and insurance costs). The following probability distribution describes the number of computers the wholesaler may possibly sell to local retailers: there is a 21% chance that they will sell 900 computers, a 56% chance that they will sell 1200 computers; otherwise, they will sell 1500 computers. What is the expected number of computers the wholesaler will sell? (please round your answer to 1 decimal place)arrow_forward
- Customers at IT Phone Call Center have been complaining that they are waiting too long for service. The managers at the call center have taken notice and asked you to do some investigating to determine the typical service time for their customers for morning shifts compared to evening shifts. You collect the following samples (time in minutes): Morning shifts: 8, 15, 16, 18, 18, 20, 21, 21, 21, 56 Evening shifts: 3, 11, 12, 14, 22, 22, 30, 33, 34, 47 Explain in detail which descriptive statistic (mean, median, or mode) you would utilize to communicate the typical service time to your boss for each shift and why. In your explanation, be sure to include which shift (morning or evening) has the quicker turn-around time.arrow_forwardUsing a sample of 500 adults with the following variables: genhelf - variable recording general self- reported health coded 1 = very good, 2 = good, 3 = fair, 4 = poor sbp - variable recording systolic blood pressure - age - age of the respondent in years sex coded 1 = male and 2 = female hi_sbp - indicator of high blood pressure coded 1 if the respondent's sbp is 130 or higher and 0 otherwise What type of chart is MOST appropriate for the variable sbp? a/ pie chart b/ bar chart c/ histogramarrow_forwardExplain in your own words what pooled variance is. If you have two different samples of different sizes (the n for each group is different_, explain wether the value of the pooled variance will be closer to the larger sample or smaller sample.arrow_forward
- Explain what "selection on unobservables" and "selection on observables" mean, in relation to the evaluation of policies with observational dataarrow_forwardConsider trying to predict the life expectancy of citizens in a country based on the birth rate (per 1000 people) in that country. Here is a scatterplot of the data from a random sample of 50 countries. > ggplot (SampCountries, aes (BirthRate, LifeExpectancy)) + geom_point (color = "darkred")+ labs (title = "Life Expectancy by Birth Rate") + Life Expectancy by Birth Rate 80 - 70 - 10 20 30 40 BirthRate Here is (some of) the R output for the linear model for this data. > LifeBirth.lm summary (LifeBirth. lm) Call: Im (formula = LifeExpectancy BirthRate, data = SampCountries) Residuals: Min 10 Median 30 Маx -7.0592 -2.3047 0.9123 2.5019 5.8358 Coefficients: Estimate Std. Error t value Pr(>|t|) (Intercept) 85.26295 1.03301 82.54 BirthRate -0.63291 0.04492 -14.09 Residual standard error: 3.424 on 48 degrees of freedom Multiple R-squared: 0.8053, Adjusted R-squared: 0.8012 F-statistic: 198.5 on 1 and 48 DF, p-value: < 2.2e-16 LifeExpectancyarrow_forwardOn a trial basis, State College admitted 300 students from the lowest third of their high school graduation class. They were randomly divided into 3 groups. Group A received extensive training in study habits Group B received motivational lectures; and Group C received no special treatment. At the end of the year, the average grades of the groups were compared. Identify the following: * What is the Independent variable? * What is the Dependent variable? * Who is in the Experimental Group? * Who is in the Control Group? * What are at least 2 potential extraneous variables?arrow_forward
- Only one can be chosenarrow_forwardDecide if the following statement is true or false and explain your reasoning: Suppose you found a sample proportion p^p^and built a 95% and 99% confidence interval around it. If the the population proportion pp is in actually the 95% confidence interval, then it must also be in the 99% confidence interval.arrow_forward
arrow_back_ios
arrow_forward_ios
Recommended textbooks for you
- MATLAB: An Introduction with ApplicationsStatisticsISBN:9781119256830Author:Amos GilatPublisher:John Wiley & Sons Inc
 Probability and Statistics for Engineering and th...StatisticsISBN:9781305251809Author:Jay L. DevorePublisher:Cengage Learning
 Statistics for The Behavioral Sciences (MindTap C...StatisticsISBN:9781305504912Author:Frederick J Gravetter, Larry B. WallnauPublisher:Cengage Learning
  Elementary Statistics: Picturing the World (7th E...StatisticsISBN:9780134683416Author:Ron Larson, Betsy FarberPublisher:PEARSON
 The Basic Practice of StatisticsStatisticsISBN:9781319042578Author:David S. Moore, William I. Notz, Michael A. FlignerPublisher:W. H. Freeman
 Introduction to the Practice of StatisticsStatisticsISBN:9781319013387Author:David S. Moore, George P. McCabe, Bruce A. CraigPublisher:W. H. Freeman
MATLAB: An Introduction with Applications
Statistics
ISBN:9781119256830
Author:Amos Gilat
Publisher:John Wiley & Sons Inc
Probability and Statistics for Engineering and th...
Statistics
ISBN:9781305251809
Author:Jay L. Devore
Publisher:Cengage Learning
Statistics for The Behavioral Sciences (MindTap C...
Statistics
ISBN:9781305504912
Author:Frederick J Gravetter, Larry B. Wallnau
Publisher:Cengage Learning
Elementary Statistics: Picturing the World (7th E...
Statistics
ISBN:9780134683416
Author:Ron Larson, Betsy Farber
Publisher:PEARSON
The Basic Practice of Statistics
Statistics
ISBN:9781319042578
Author:David S. Moore, William I. Notz, Michael A. Fligner
Publisher:W. H. Freeman
Introduction to the Practice of Statistics
Statistics
ISBN:9781319013387
Author:David S. Moore, George P. McCabe, Bruce A. Craig
Publisher:W. H. Freeman