MATLAB: An Introduction with Applications
6th Edition
ISBN: 9781119256830
Author: Amos Gilat
Publisher: John Wiley & Sons Inc
expand_more
expand_more
format_list_bulleted
Question
The correct conclusion is that we conclude that the average length of stay of all surgeries of this type days.
What level of concern do you have for the validity of your results?
Low our
Moderate
the original data is not normally distributed which is an assumptions violation
Extreme
we should not use any part of what we've done to make a conclusion
None
our sample size is larger than 30 so there should be no problem with the conclusion

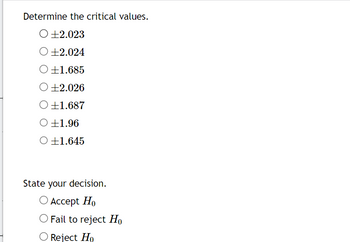
Transcribed Image Text:Determine the critical values.
O +2.023
O +2.024
O+1.685
O +2.026
O +1.687
O +1.96
O +1.645
State your decision.
O Accept Ho
O Fail to reject Ho
O Reject Ho

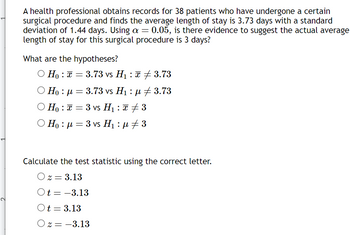
Transcribed Image Text:A health professional obtains records for 38 patients who have undergone a certain
surgical procedure and finds the average length of stay is 3.73 days with a standard
deviation of 1.44 days. Using a = 0.05, is there evidence to suggest the actual average
length of stay for this surgical procedure is 3 days?
What are the hypotheses?
O Ho: x= 3.73 vs H₁ : 3.73
☎ ‡
Ο Ηo : μ
= 3.73 vs H₁ : µ ‡ 3.73
O Ho: = 3 vs H₁ : x ‡ 3
Hoμ = 3 vs H₁ : µ ‡ 3
Calculate the test statistic using the correct letter.
Oz = 3.13
Ot=-3.13
Ot = 3.13
Oz = -3.13
SAVE
AI-Generated Solution
info
AI-generated content may present inaccurate or offensive content that does not represent bartleby’s views.
Unlock instant AI solutions
Tap the button
to generate a solution
to generate a solution
Click the button to generate
a solution
a solution
Knowledge Booster
Similar questions
- I'm working a case study for statistics and I wanted to verify if I did the problem correctly before submittal. Can you please look over my answer? Thank you for your assistance Question: Standard Deviation - Which state has the greatest standard deviation? Explain your reasoning. My answer Indiana is the state that has the greatest standard deviation. The findings suggest that the quantity of employees varied more compared to the mean value. Thank you for assistance, I greatly appreciate your help!arrow_forwardThis research was conducted with Korean adolescents in the Los Angeles area. Would you be willing to generalize the results of this study to Korean adolescents who live in other regions of the country? Why or why not.arrow_forward/transcript Call centers typically have high turnover. The director of human resources for a large bank has compiled data on about 70 former employees at one of the bank's call centers. The accompanying table shows this data. In writing an article about call center working conditions, a reporter has claimed that the average tenure is no more than two years. Formulate and test a hypothesis using these data to determine if this claim can be disputed. Use a level of significance of 0.05. Click the icon to view the call center data. Is there sufficient evidence at the 0.05 level of significance that the average tenure is no more than two years? Determine the null hypothesis, Ho, and the alternative hypothesis, H₁. Ho ... H₁: (Type whole numbers.) le Learrow_forward
- The mean and standard deviation of Carbon concentration is 5 mg/L and 2 mg/L based on 25 samples from a river. The mean and standard deviation of Nitrogen concentration is 7 mg/L and 3 mg/L based on 35 samples from the same river. The experimenter wants to answer the question if the Nitrogen concentration is higher than the Carbon concentration. Which of the following methods do you use? Z-test, Default Procedure Z-test, Pooled Variance Procedure T-test, Pooled Variance Procedure T-test, Default Procedurearrow_forwardPLEASE ANSWER ALL THE PARTS OF THE QUESTION ( THIS IS NOT A GRADED ASSIGNMENT)arrow_forwardplease help me fill the rest thanksarrow_forward
- You suspect that drivers for Uber/Lyft have newer cars than a driver who doesn’t drive for Uber/Lyft. Listed below are the ages of cars that you randomly sampled from the streets of Portland. If one were to conduct a hypothesis test for the difference in mean car age and mean Uber/Lyft car age, the conditions for the test would need to be checked. What conditions should you check? Check the conditions and explain how the conditions are met or not. What is the appropriate test to conduct, an independent samples t test or paired t test? Explain. Uber/Lyft car age 4 0 8 11 14 3 4 4 3 5 8 3 3 7 4 6 6 1 8 2 15 11 4 Non-Uber/Lyft Car age 8 8 0 3 8 4 3 3 6 11 7 7 6 9 5 10 8 4 3 4arrow_forwardWhat are two tools which test how close the dispersion of data matches the distribution shape of a normal curve?arrow_forwardPlease sir or ma’am, please help me with hypothesis, critical region, and t statistic.arrow_forward
arrow_back_ios
arrow_forward_ios
Recommended textbooks for you
 MATLAB: An Introduction with ApplicationsStatisticsISBN:9781119256830Author:Amos GilatPublisher:John Wiley & Sons Inc
 Probability and Statistics for Engineering and th...StatisticsISBN:9781305251809Author:Jay L. DevorePublisher:Cengage Learning
 Statistics for The Behavioral Sciences (MindTap C...StatisticsISBN:9781305504912Author:Frederick J Gravetter, Larry B. WallnauPublisher:Cengage Learning
 Elementary Statistics: Picturing the World (7th E...StatisticsISBN:9780134683416Author:Ron Larson, Betsy FarberPublisher:PEARSON
 The Basic Practice of StatisticsStatisticsISBN:9781319042578Author:David S. Moore, William I. Notz, Michael A. FlignerPublisher:W. H. Freeman
 Introduction to the Practice of StatisticsStatisticsISBN:9781319013387Author:David S. Moore, George P. McCabe, Bruce A. CraigPublisher:W. H. Freeman

MATLAB: An Introduction with Applications
Statistics
ISBN:9781119256830
Author:Amos Gilat
Publisher:John Wiley & Sons Inc

Probability and Statistics for Engineering and th...
Statistics
ISBN:9781305251809
Author:Jay L. Devore
Publisher:Cengage Learning

Statistics for The Behavioral Sciences (MindTap C...
Statistics
ISBN:9781305504912
Author:Frederick J Gravetter, Larry B. Wallnau
Publisher:Cengage Learning

Elementary Statistics: Picturing the World (7th E...
Statistics
ISBN:9780134683416
Author:Ron Larson, Betsy Farber
Publisher:PEARSON

The Basic Practice of Statistics
Statistics
ISBN:9781319042578
Author:David S. Moore, William I. Notz, Michael A. Fligner
Publisher:W. H. Freeman

Introduction to the Practice of Statistics
Statistics
ISBN:9781319013387
Author:David S. Moore, George P. McCabe, Bruce A. Craig
Publisher:W. H. Freeman