MATLAB: An Introduction with Applications
6th Edition
ISBN: 9781119256830
Author: Amos Gilat
Publisher: John Wiley & Sons Inc
expand_more
expand_more
format_list_bulleted
Question

Transcribed Image Text:alt
A health care professional wishes to estimate the birth weights of infants. How large a sample
must be obtained if he desires to be 95% confident that the true mean weight is within 2 ounces
of the sample mean? Assume the population standard deviation is 6 ounces
9
a
Z
2.05
W
S
BBBA084
JODOL
t
X
d
C
f
%
5
6.0
b
y
h
&
7
n
C
J
m
k
O
alt
р
ctrl
[
?
1
}
backsp
1

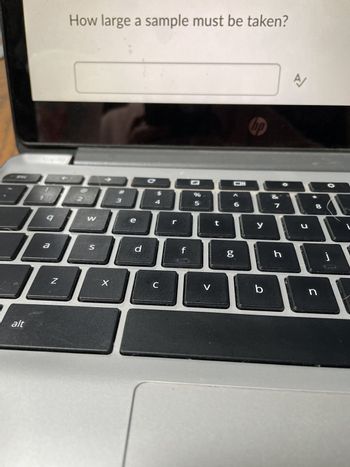
Transcribed Image Text:alt
9
a
How large a sample must be taken?
N
%
73888888
W
S
X
e
d
C
f
V
Oll
t
6.0
hp
6
y
b
A
h
J
n
j
Expert Solution
This question has been solved!
Explore an expertly crafted, step-by-step solution for a thorough understanding of key concepts.
This is a popular solution
Trending nowThis is a popular solution!
Step by stepSolved in 4 steps with 2 images

Knowledge Booster
Similar questions
- A medical staff who knows statistics is concerned with the weights of babies. What's the minimum sample size needed to be 97% confident that the true mean is within 2.1 ounces of the sample mean? The standard deviation of the weights is known to be 7 ounces.arrow_forwardAn engineer wishes to determine the width of a particular Electronic Component. If she knows that the standard deviation is 3.8 mm how many of these components should she consider to be 90% sure that mean will be 0.2 mmarrow_forwardwe want to obtain a sample to estimate a population mean. Based on previous evidence, researchers believe the population standard deviation is approximately 38.7. We would like to be 99% confident that the estimate is within 4 of the true population mean. How large of a sample size is required ?arrow_forward
- A quantitative data set has a size 50. At least how many observations lie within 3standard deviations to either side of the mean?arrow_forwardplease answer the question in the photo. Thank youarrow_forwardTo compare the dry braking distances from 30 to 0 miles per hour for two makes of automobiles, a safety engineer conducts braking tests for 35 models of Make A and 35 models of Make B. The mean braking distance for Make A is 42 feet. Assume the population standard deviation is 4.7 feet. The mean braking distance for Make B is 45 feet. Assume the population standard deviation is 4.4 feet. At a = 0.10, can the engineer support the claim that the mean braking distances are different for the two makes of automobiles? Assume the samples are random and independent, and the populations are normally distributed. Complete parts (a) rari rz (b) Find the critical value(s) and identify the rejection region(s). The critical value(s) is/are (Round to three decimal places as needed. Use a comma to separate answers as needed.)arrow_forward
- Show complete solution for each item. don't type it. write it on paperarrow_forwardFor a random sample of 10 men, the mean head circumferences are x-bar = 57.3 cm, and the sample standard deviation is s = 2cm. what is the standard error of the mean?arrow_forwardLevels of a certain enzyme in the blood have a mean value of 34.0 mg/mL and a standard deviation of 3.5 mg/mL. Complete the following steps to determine what levels of the enzyme correspond to the top 20% of test results. Are you calculating the top or bottom 20%? Answer So, which percentage needs to be converted to an area? Answer What is the area that you will look for in the table (four decimal places)? Answer What area will you actually use from the table (four decimal places)? Answer What is the z-score associated with that area (two decimal places)? Answer What is the cutoff level of the enzyme that corresponds to the top 20% of test results? (round to the nearest tenths) Answer Are values lower or higher than that value also in the top 20%? Answerarrow_forward
arrow_back_ios
arrow_forward_ios
Recommended textbooks for you
 MATLAB: An Introduction with ApplicationsStatisticsISBN:9781119256830Author:Amos GilatPublisher:John Wiley & Sons Inc
 Probability and Statistics for Engineering and th...StatisticsISBN:9781305251809Author:Jay L. DevorePublisher:Cengage Learning
 Statistics for The Behavioral Sciences (MindTap C...StatisticsISBN:9781305504912Author:Frederick J Gravetter, Larry B. WallnauPublisher:Cengage Learning
 Elementary Statistics: Picturing the World (7th E...StatisticsISBN:9780134683416Author:Ron Larson, Betsy FarberPublisher:PEARSON
 The Basic Practice of StatisticsStatisticsISBN:9781319042578Author:David S. Moore, William I. Notz, Michael A. FlignerPublisher:W. H. Freeman
 Introduction to the Practice of StatisticsStatisticsISBN:9781319013387Author:David S. Moore, George P. McCabe, Bruce A. CraigPublisher:W. H. Freeman

MATLAB: An Introduction with Applications
Statistics
ISBN:9781119256830
Author:Amos Gilat
Publisher:John Wiley & Sons Inc

Probability and Statistics for Engineering and th...
Statistics
ISBN:9781305251809
Author:Jay L. Devore
Publisher:Cengage Learning

Statistics for The Behavioral Sciences (MindTap C...
Statistics
ISBN:9781305504912
Author:Frederick J Gravetter, Larry B. Wallnau
Publisher:Cengage Learning

Elementary Statistics: Picturing the World (7th E...
Statistics
ISBN:9780134683416
Author:Ron Larson, Betsy Farber
Publisher:PEARSON

The Basic Practice of Statistics
Statistics
ISBN:9781319042578
Author:David S. Moore, William I. Notz, Michael A. Fligner
Publisher:W. H. Freeman

Introduction to the Practice of Statistics
Statistics
ISBN:9781319013387
Author:David S. Moore, George P. McCabe, Bruce A. Craig
Publisher:W. H. Freeman