
MATLAB: An Introduction with Applications
6th Edition
ISBN: 9781119256830
Author: Amos Gilat
Publisher: John Wiley & Sons Inc
expand_more
expand_more
format_list_bulleted
Related questions
Concept explainers
Question
Identify the test statistic for this hypothesis test.
Identify the p-value for this hypothesis test.
Identify the conclusion for this hypothesis test.
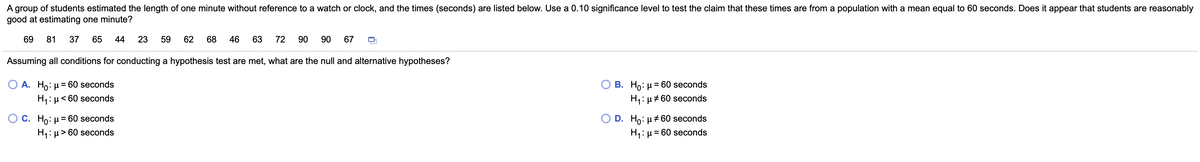

Transcribed Image Text:A group of students estimated the length of one minute without reference to a watch or clock, and the times (seconds) are listed below. Use a 0.10 significance level to test the claim that these times are from a population with a mean equal to 60 seconds. Does it appear that students are reasonably
good at estimating one minute?
69
81
37
65
44
23
59
62
68
46
63
72
90
90
67
Assuming all conditions for conducting a hypothesis test are met, what are the null and alternative hypotheses?
A. Ho: µ = 60 seconds
< 60 seconds
В. Но: и3D 60 seconds
H: µ<
H1: µ#60 seconds
С. Но и
= 60 seconds
D. Ho: µ+60 seconds
H1: µ> 60 seconds
= 60 seconds
Expert Solution
This question has been solved!
Explore an expertly crafted, step-by-step solution for a thorough understanding of key concepts.

This is a popular solution

Trending nowThis is a popular solution!

Step by stepSolved in 2 steps with 2 images

Knowledge Booster


Learn more about
Need a deep-dive on the concept behind this application? Look no further. Learn more about this topic, statistics and related others by exploring similar questions and additional content below.Similar questions
- please answer following question attachedarrow_forwardDescribe the type I error and the type II error for a hypothesis tests of the given claim. The proportion of settled medical malpractice suits is 0.22. Which of the following is a type I error? A. Reject the claim that the proportion of settled malpractice suits is 0.22 when the proportion is actually different from 0.22. O B. Fail to reject the claim that the proportion of settled malpractice suits is 0.22 when the proportion is actually different from 0.22. C. Fail to reject the claim that the proportion of settled malpractice suits is 0.22 when the proportion is actually 0.22. O D. Reject the claim that the proportion of settled malpractice suits is 0.22 when the proportion is actually 0.22. Which of the following is a type II error? O A. Reject the claim that the proportion of settled malpractice suits is 0.22 when the proportion is actually different from 0.22. O B. Reject the claim that the proportion of settled malpractice suits is 0.22 when the proportion is actually 0.22. O C.…arrow_forwardUse the one-proportion z-test to perform the specified hypothesis test. Use the critical-value approach. x= 345, n = 1000, Ho: p= 0.35, Hạ: p > 0.35, a= 0.01 A. z= - 0.33; critical value =2.575; do not reject Ho B. z=0.62; critical value = 2.33; do not reject Ho C. z= 0.62; critical value =2.575; reject Ho D. z= - 0.33; critical value = 2.33; do not reject Hoarrow_forward
- Use technology to find the P-value for the hypothesis test described below. The claim is that for a smartphone carrier's data speeds at airports, the mean is μ=13.00 Mbps. The sample size is n=28 and the test statistic is t=−1.288.arrow_forwardH.P. statistician, please show work and neat handwritingarrow_forwardUse technology to find the P-value for the hypothesis test described below. The claim is that for a smartphone carrier's data speeds at airports, the mean is μ = 11.00 Mbps. The sample size is n = 28 and the test statistic is t = 2.358.arrow_forward
- The Department of Health plans to test the lead level in a specific park. Because a high lead level is harmful to children, the park will be closed if the lead level exceeds the allowed limit. The department randomly selects several locations in the park, gets soil samples from those locations, and tests the samples for their lead levels. Write the correct null hypothesis (H_O) for this problem. * Your answer Write the correct alternative hypothesis for this problem. * Your answer Which of the following decisions would result from the Type I error? * None of these Keeping the park open when the lead levels are in excess of the allowed limit. Closing the park when the lead levels are in excess of the allowed limit Closing the park because of the increased noise level in the neighborhood Keeping the park open when the lead levels are within the allowed limitarrow_forwardUse technology to find the P-value for the hypothesis test described below. The claim is that for the population of adult males, the mean platelet count is μ>210. The sample size is n=48 and the test statistic is t=1.798.arrow_forwardShow your complete solution II. Use an appropriate statistical tool to test the hypothesis. Use the stepwise method of hypothesis testing. 3. A researcher observed that students preferred several online class platforms. For this reason, he performs a survey to know whether or not gender is associated with online class platforms preference and he was able to gathered the following data Zoom Google Meet MS Teams Total Male 110 95 40 245 Female 105 100 50 255 Total 215 195 90 500arrow_forward
- WHen writing a null hypothesis for a two sample t test. Do you write U1 = U2 or U1 - U2 = 0? Or do both of them work?arrow_forwardIdentify the claim and state Ho and H Determine whether the hypothesis test is left-tailed, right-tailed, or two-tailed, and whether to use a z-test, a t-test, or a chi-square test. Explain your reasoning. Find the critical value(s), identify the rejection region(s), and find the appropriate standardized test statistic. Decide whether to reject or fail to reject the null hypothesis. Interpret the decision in the context of the original claim. A government agency reports that the mean amount of earnings for full-time workers ages 25 to 34 with a master’s degree is less than $70,000. In a random sample of 15 full-time workers ages 25 to 34 with a master’s degree, the mean amount of earnings is $66,231 and the standard deviation is $5945. At α = 0.05, is there enough evidence to support the agency’s claim? Assume the population is normally distributed.arrow_forward
arrow_back_ios
arrow_forward_ios
Recommended textbooks for you
- MATLAB: An Introduction with ApplicationsStatisticsISBN:9781119256830Author:Amos GilatPublisher:John Wiley & Sons Inc
 Probability and Statistics for Engineering and th...StatisticsISBN:9781305251809Author:Jay L. DevorePublisher:Cengage Learning
 Statistics for The Behavioral Sciences (MindTap C...StatisticsISBN:9781305504912Author:Frederick J Gravetter, Larry B. WallnauPublisher:Cengage Learning
  Elementary Statistics: Picturing the World (7th E...StatisticsISBN:9780134683416Author:Ron Larson, Betsy FarberPublisher:PEARSON
 The Basic Practice of StatisticsStatisticsISBN:9781319042578Author:David S. Moore, William I. Notz, Michael A. FlignerPublisher:W. H. Freeman
 Introduction to the Practice of StatisticsStatisticsISBN:9781319013387Author:David S. Moore, George P. McCabe, Bruce A. CraigPublisher:W. H. Freeman
MATLAB: An Introduction with Applications
Statistics
ISBN:9781119256830
Author:Amos Gilat
Publisher:John Wiley & Sons Inc
Probability and Statistics for Engineering and th...
Statistics
ISBN:9781305251809
Author:Jay L. Devore
Publisher:Cengage Learning
Statistics for The Behavioral Sciences (MindTap C...
Statistics
ISBN:9781305504912
Author:Frederick J Gravetter, Larry B. Wallnau
Publisher:Cengage Learning
Elementary Statistics: Picturing the World (7th E...
Statistics
ISBN:9780134683416
Author:Ron Larson, Betsy Farber
Publisher:PEARSON
The Basic Practice of Statistics
Statistics
ISBN:9781319042578
Author:David S. Moore, William I. Notz, Michael A. Fligner
Publisher:W. H. Freeman
Introduction to the Practice of Statistics
Statistics
ISBN:9781319013387
Author:David S. Moore, George P. McCabe, Bruce A. Craig
Publisher:W. H. Freeman