
MATLAB: An Introduction with Applications
6th Edition
ISBN: 9781119256830
Author: Amos Gilat
Publisher: John Wiley & Sons Inc
expand_more
expand_more
format_list_bulleted
Related questions
Question
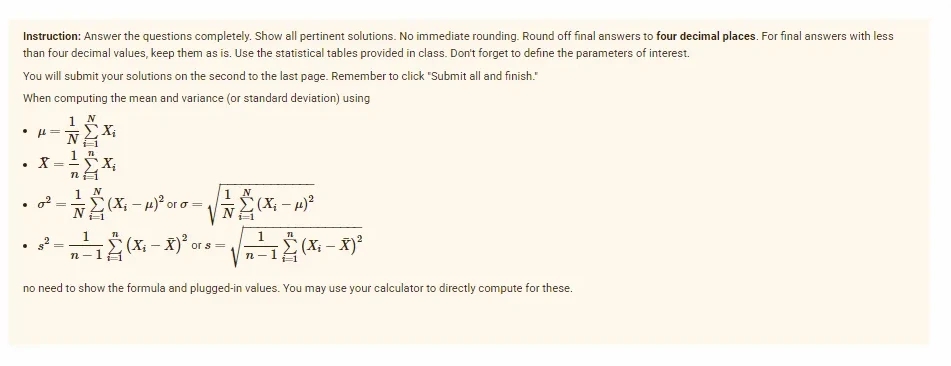

Transcribed Image Text:Instruction: Answer the questions completely. Show all pertinent solutions. No immediate rounding. Round off final answers to four decimal places. For final answers with less
than four decimal values, keep them as is. Use the statistical tables provided in class. Don't forget to define the parameters of interest.
You will submit your solutions on the second to the last page. Remember to click "Submit all and finish."
When computing the mean and variance (or standard deviation) using
X;
X = X;
1
1 N
1 N
(X; – 4)?
or o=
1
1
(X; – X)²
or s=
n-1 (X; – X)²
no need to show the formula and plugged-in values. You may use your calculator to directly compute for these.
of

Transcribed Image Text:A group of researchers wants to do a comparative study on auditory reaction time (ART) and visual reaction time (VRT) of Visual Arts majors. They took a sample of twenty
college students who majored in Visual Arts, and each was given a unique serial number. In their study, two tasks were administered: (1) a VRT task where they need to press
the spacebar of the computer keyboard once a red dot appears on the screen and (2) an ART task where a 20-second sound will be played, and the participants need to press
the spacebar once the sound is presented. A randomization mechanism was done to determine which task would be administered first. The tables of the reaction times are
shown below:
Visual Task
Reaction
Auditory Task
Reaction
Time
Student
Student
Time
1.37
1
1.13
2
1.05
2
1.05
3
1.33
3
1.30
4
1.08
4
1.01
5
1.15
1.38
1.10
6
1.18
7
1.03
7
0.87
8
1.45
8
1.16
9
0.78
0.75
10
1.07
10
0.98
11
0.84
11
1.22
12
1.34
12
1.03
13
1.47
13
1.16
14
0.97
14
1.07
15
1.66
15
1.18
16
0.76
16
0.78
17
1.16
17
1.00
18
0.78
18
0.89
19
1.09
19
0.85
20
1.23
20
0.83
Is there sufficient evidence to conclude that Visual Arts majors perform better in the VRT task than in the ART task? Test at 0.05 level of significance.
Expert Solution
This question has been solved!
Explore an expertly crafted, step-by-step solution for a thorough understanding of key concepts.

Step by stepSolved in 2 steps

Follow-up Questions
Read through expert solutions to related follow-up questions below.
Follow-up Question

Transcribed Image Text:A group of researchers wants to do a comparative study on auditory reaction time (ART) and visual reaction time (VRT) of Visual Arts majors. They took a sample of twenty
college students who majored in Visual Arts, and each was given a unique serial number. In their study, two tasks were administered: (1) a VRT task where they need to press
the spacebar of the computer keyboard once a red dot appears on the screen and (2) an ART task where a 20-second sound will be played, and the participants need to press
the spacebar once the sound is presented. A randomization mechanism was done to determine which task would be administered first. The tables of the reaction times are
shown below:
Visual Task
Auditory Task
Reaction
Reaction
Student
Student
Time
Time
1.37
1
1.13
1.05
2
1.05
3
1.33
3
1.30
4
1.08
4
1.01
1.15
1.38
1.10
6
1.18
7
1.03
7
0.87
8
1.45
1.16
0.78
0.75
10
1.07
10
0.98
11
0.84
11
1.22
12
1.34
12
1.03
13
1.47
1.16
14
0.97
14
1.07
15
1.66
15
1.18
16
0.76
16
0.78
17
1.16
17
1.00
18
0.78
18
0.89
19
1.09
19
0.85
20
1.23
20
0.83
Based on the given statistical table/s, the p-value lies between
and
Does this support your conclusion above?
3 4 5 O
Solution
by Bartleby Expert
Follow-up Questions
Read through expert solutions to related follow-up questions below.
Follow-up Question
Transcribed Image Text:A group of researchers wants to do a comparative study on auditory reaction time (ART) and visual reaction time (VRT) of Visual Arts majors. They took a sample of twenty
college students who majored in Visual Arts, and each was given a unique serial number. In their study, two tasks were administered: (1) a VRT task where they need to press
the spacebar of the computer keyboard once a red dot appears on the screen and (2) an ART task where a 20-second sound will be played, and the participants need to press
the spacebar once the sound is presented. A randomization mechanism was done to determine which task would be administered first. The tables of the reaction times are
shown below:
Visual Task
Auditory Task
Reaction
Reaction
Student
Student
Time
Time
1.37
1
1.13
1.05
2
1.05
3
1.33
3
1.30
4
1.08
4
1.01
1.15
1.38
1.10
6
1.18
7
1.03
7
0.87
8
1.45
1.16
0.78
0.75
10
1.07
10
0.98
11
0.84
11
1.22
12
1.34
12
1.03
13
1.47
1.16
14
0.97
14
1.07
15
1.66
15
1.18
16
0.76
16
0.78
17
1.16
17
1.00
18
0.78
18
0.89
19
1.09
19
0.85
20
1.23
20
0.83
Based on the given statistical table/s, the p-value lies between
and
Does this support your conclusion above?
3 4 5 O
Solution
by Bartleby Expert
Knowledge Booster

Similar questions
- Researchers compared the effectiveness of a mood induction technique (exposure to depressing film footage) across 3 different groups of 11 participants each: 1) 0 minutes exposure (Control Group), 2) 10 minutes exposure, & 3) 20 minutes exposure. The response variable is the score on the Beck Depression Inventory (higher score = more depressed mood). M1 = 7 M2 = 11 M3 = 12 SS1 = 56 SS2 = 96 SS3 = 62 n1 = 11 n2 = 11 n3 = 11 SSTOTAL = 368 Which of the hypotheses is listed incorrectly? Select all that apply a)H0: μ1 > μ2 > μ3 B)H0: μ1 = μ2 = μ3 c)H1: μ1 ≠ μ2 ≠ μ3 d)H1: μ1 < μ2 < μ3arrow_forwardI have gotten this wrong twice and I don't know where I am going wrong. Please provide the detailed steps and formulas needed for me to complete this accurately. Thank you kindly.arrow_forwardIn the year 2000, the state of Indiana began a $40-million renovation of its state fairgrounds, which included the building of a miniature golf course and a state- of-the-art livestock building. Now, Indiana officials are interested in learning what sorts of people are visiting the new attractions. In a survey done at this year's state fair, it was found that, among a random sample of 80 couples at the fair with their children, 54 had visited the new miniature golf course, and among an independently chosen, random sample of 65 couples at the fair on a date (without children), 31 had visited the miniature golf course. Based on these samples, can we conclude, at the 0.05 level of significance, that the proportion p, of all couples attending the fair with their children who visited the miniature golf course is different from the proportion p, of all couples attending the fair on a date who visited the miniature golf course? Perform a two-tailed test. Then complete the parts below. Carry…arrow_forward
- Two different blood pressure medicines are being compared to determine if the average reduction in blood pressure is the same for each medication. The goal of the study is to determine if the medications differ. Twenty men age 50-60 years old are selected for the study. Ten men are chosen at random to receive the first medication and the other 10 men receive the second medication. Each of the 20 men is monitored for one month to determine the change in blood pressure over that time. Minitab provides the 95% confidence interval for (mu1 - mu2) (2.63, 14.18) a. Interpret this 95% CI. b. What assumptions (be specific) are necessary to construct this CI?arrow_forwardA paper describes a study of the use of MRI (Magnetic Resonance Imaging) exams in the diagnosis of breast cancer. The purpose of the study was to determine if MRI exams do a better job than mammograms of determining if women who have recently been diagnosed with cancer in one breast have cancer in the other breast. The study participants were 940 women who had been diagnosed with cancer in one breast and for whom a mammogram did not detect cancer in the other breast.These women had an MRI exam of the other breast, and 111 of those exams indicated possible cancer. After undergoing biopsies, it was determined that 30 of the 111 did in fact have cancer in the other breast, whereas 81 did not. The women were all followed for one year, and four of the women for whom the MRI exam did not indicate cancer in the other breast were subsequently diagnosed with cancer that the MRI did not detect. The accompanying table summarizes this information. CancerPresent Cancer NotPresent Total MRI…arrow_forwardResearchers investigate how the presence of cell phones influence the quality of human interaction. Subjects are randomly selected from a population and divided into an experimental group that is asked to leave their phones in the front of the room and a control group that are not asked to leave their cell phones at the front of the room. Subjects are left alone for 10 minutes and then asked to take a survey designed to measure quality of interactions they had with others in the experiment. What statistical test is appropriate?arrow_forward
- After visiting the Titanic, Captain Brain and Mr. Pinky are taking the Alvin submarine back to the surface of the water. They start 1900 meters below the surface of the water, and ascend at 62 meters per hour.Note: under the water is a negative number.Write an equation to model this situation (use mm for meters and hh for hours)arrow_forwardA team of researchers is interested in the effect on physical health of writing about thoughts and feelings associated with traumatic life events (expressive writing). The researchers recruit 30 undergraduate students to take part in the study and randomly assign them to be in an expressive writing group or a control group. Students in the expressive writing group are instructed to write four 20 - minute essays over four consecutive days about their most traumatic life experiences. Students in the control group write four 20 – minute essays over consecutive days describing their plans for that day. One week later, the researchers ask the students to rate their overall level of physical health (on a scale 0 = very poor health, to 100 = perfect health). EWG: 75, 86, 77, 91, 68, 74, 62, 93, 82, 79, 94, 56, 79, 86, 90, 97 CWG: 81, 76, 71, 70, 62, 50, 58, 63, 76, 64, 65, 72, 52, 59 The researchers were interested in identifying a positive or a negative health effect of expressive writing.…arrow_forwardA paper describes a study of the use of MRI (Magnetic Resonance Imaging) exams in the diagnosis of breast cancer. The purpose of the study was to determine if MRI exams do a better job than mammograms of determining if women who have recently been diagnosed with cancer in one breast have cancer in the other breast. The study participants were 950 women who had been diagnosed with cancer in one breast and for whom a mammogram did not detect cancer in the other breast. These women had an MRI exam of the other breast, and 101 of those exams indicated possible cancer. After undergoing biopsies, it was determined that 30 of the 101 did in fact have cancer in the other breast, whereas 71 did not. The women were all followed for one year, and four of the women for whom the MRI exam did not indicate cancer in the other breast were subsequently diagnosed with cancer that the MRI did not detect. The accompanying table summarizes this information. Cancer Cancer Not Present Present Total MRI…arrow_forward
- Trichotillomania is a psychiatric illness that causes its victims to have an irresistible compulsion to pull their own hair. Two drugs were compared as treatments for trichotillomania in a study involving 13 women. Each women took clomipramine during one time period and desipramine during another time period in a double-blind experiment. Scores on a trichotillomania-impairment scale, in which high scores indicate greater impairment, were measured on each women during time period. The average of the 13 measurements for clomipramine was 6.2; the average of the 13 measurements for desipramine as 4.2. (a) A paired t test was used to test whether the mean difference between these two drugs is 0, resulting in a test statistics t∗ = 2.47. Find the sample standard deviation Sd. (b) Find a 95% confidence interval for the mean difference between the two drugs and give the conclusion.arrow_forwardAn article included data from a survey of 2500 hiring managers and human resource professionals. The article noted that many employers are using social networks to screen job applicants and that this practice is becoming more common. Of the 2500 people who participated in the survey, 1250 indicated that they use social networking sites (such as Facebook, MySpace, and LinkedIn) to research job applicants. For the purposes of this exercise, assume that the sample is representative of hiring managers and human resource professionals -Why can this sampling distribution be considered normal? Explain and show why. -Construct a 95% confidence interval for the true population proportion of employers who use social networking sites to screen job applicants. Be sure to write a conclusion sentence that interprets your interval. (You may use Excel for this -Construct a 99% confidence interval for the true population proportion of employers who use social networking sites to screen job applicants.…arrow_forwardDr. Mackintosh believes a new olfactory therapy would be more successful in promoting weight loss among obese patients. His patients are first weighed and then randomly assigned to olfactory therapy, dance therapy, or a control condition. At the end of the three weeks, the amount of weight lost is recorded. The results indicate no significant difference in the amount of weight lost between the three conditions. If true differences existed between the conditions, but they were not detected, what kind of error occurred?arrow_forward
arrow_back_ios
SEE MORE QUESTIONS
arrow_forward_ios
Recommended textbooks for you
- MATLAB: An Introduction with ApplicationsStatisticsISBN:9781119256830Author:Amos GilatPublisher:John Wiley & Sons Inc
 Probability and Statistics for Engineering and th...StatisticsISBN:9781305251809Author:Jay L. DevorePublisher:Cengage Learning
 Statistics for The Behavioral Sciences (MindTap C...StatisticsISBN:9781305504912Author:Frederick J Gravetter, Larry B. WallnauPublisher:Cengage Learning
  Elementary Statistics: Picturing the World (7th E...StatisticsISBN:9780134683416Author:Ron Larson, Betsy FarberPublisher:PEARSON
 The Basic Practice of StatisticsStatisticsISBN:9781319042578Author:David S. Moore, William I. Notz, Michael A. FlignerPublisher:W. H. Freeman
 Introduction to the Practice of StatisticsStatisticsISBN:9781319013387Author:David S. Moore, George P. McCabe, Bruce A. CraigPublisher:W. H. Freeman
MATLAB: An Introduction with Applications
Statistics
ISBN:9781119256830
Author:Amos Gilat
Publisher:John Wiley & Sons Inc
Probability and Statistics for Engineering and th...
Statistics
ISBN:9781305251809
Author:Jay L. Devore
Publisher:Cengage Learning
Statistics for The Behavioral Sciences (MindTap C...
Statistics
ISBN:9781305504912
Author:Frederick J Gravetter, Larry B. Wallnau
Publisher:Cengage Learning
Elementary Statistics: Picturing the World (7th E...
Statistics
ISBN:9780134683416
Author:Ron Larson, Betsy Farber
Publisher:PEARSON
The Basic Practice of Statistics
Statistics
ISBN:9781319042578
Author:David S. Moore, William I. Notz, Michael A. Fligner
Publisher:W. H. Freeman
Introduction to the Practice of Statistics
Statistics
ISBN:9781319013387
Author:David S. Moore, George P. McCabe, Bruce A. Craig
Publisher:W. H. Freeman